Back to main page
DREAM Module Identification Challenge – Consensus modules
PPI-STRING_Consensus_mod96
| Assigned name |
NA |
| Network |
PPI-STRING |
| Module ID |
PPI-STRING_Consensus_mod96 |
| Module size |
21 genes |
|
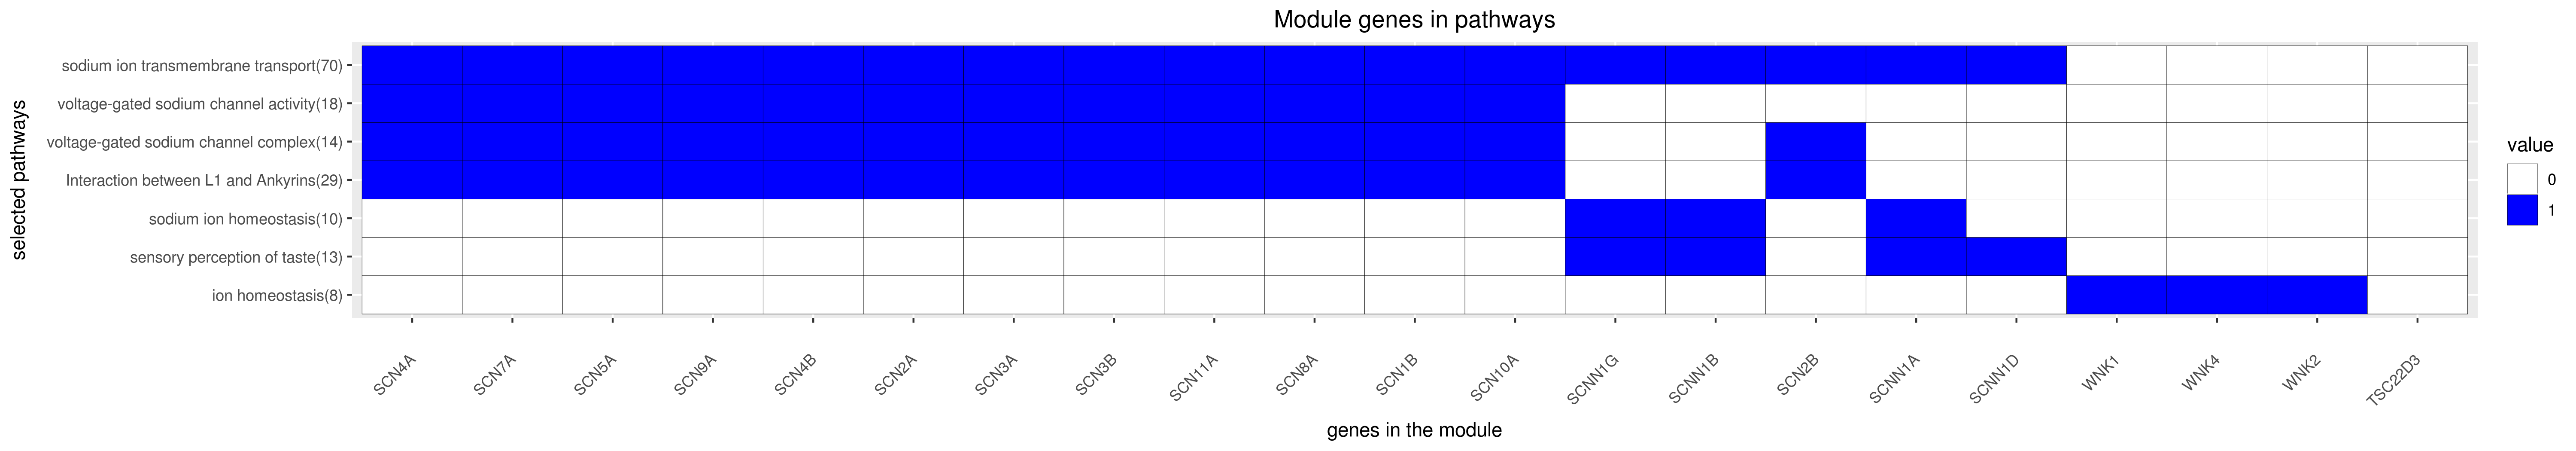
Module genes
This module comprises the following genes:
| Gene ID |
Gene Symbol |
Gene Name |
| 6336
|
SCN10A
|
sodium voltage-gated channel alpha subunit 10
|
| 11280
|
SCN11A
|
sodium voltage-gated channel alpha subunit 11
|
| 6324
|
SCN1B
|
sodium voltage-gated channel beta subunit 1
|
| 6326
|
SCN2A
|
sodium voltage-gated channel alpha subunit 2
|
| 6327
|
SCN2B
|
sodium voltage-gated channel beta subunit 2
|
| 6328
|
SCN3A
|
sodium voltage-gated channel alpha subunit 3
|
| 55800
|
SCN3B
|
sodium voltage-gated channel beta subunit 3
|
| 6329
|
SCN4A
|
sodium voltage-gated channel alpha subunit 4
|
| 6330
|
SCN4B
|
sodium voltage-gated channel beta subunit 4
|
| 6331
|
SCN5A
|
sodium voltage-gated channel alpha subunit 5
|
| 6332
|
SCN7A
|
sodium voltage-gated channel alpha subunit 7
|
| 6334
|
SCN8A
|
sodium voltage-gated channel alpha subunit 8
|
| 6335
|
SCN9A
|
sodium voltage-gated channel alpha subunit 9
|
| 6337
|
SCNN1A
|
sodium channel epithelial 1 alpha subunit
|
| 6338
|
SCNN1B
|
sodium channel epithelial 1 beta subunit
|
| 6339
|
SCNN1D
|
sodium channel epithelial 1 delta subunit
|
| 6340
|
SCNN1G
|
sodium channel epithelial 1 gamma subunit
|
| 1831
|
TSC22D3
|
TSC22 domain family member 3
|
| 65125
|
WNK1
|
WNK lysine deficient protein kinase 1
|
| 65268
|
WNK2
|
WNK lysine deficient protein kinase 2
|
| 65266
|
WNK4
|
WNK lysine deficient protein kinase 4
|
|
Functional annotation
Modules were tested for enrichment in functional and pathway annotations using two complementary approaches:
1. To select a small number of specific / non-redundant annotations for each module, a regression-based approach was used;
2. To obtain the complete set of enriched annotations, an extension of Fisher’s exact test that takes annotation bias into account was employed (Wallenius’ non-central hypergeometric distribution).
Most specific annotations for this module
1Regression coefficient
2Fisher’s exact test nominal P-value
3Annotation source (Reactome, GO biological process (BP), molecular function (MF) and cellular component (CC))
4GO category or Reactome pathway
5High-level branch of annotation tree
Gene membership
All enriched annotations
Gene Ontology
11Nominal enrichment p-value (Wallenius’ noncentral hypergeometric distribution)
2FDR corrected p-value (Benjamini-Hochberg)
Reactome
| P-value1 |
FDR2 |
Term |
| 0.00e+00
|
0.00e+00
|
L1CAM INTERACTIONS
|
| 0.00e+00
|
0.00e+00
|
INTERACTION BETWEEN L1 AND ANKYRINS
|
| 0.00e+00
|
0.00e+00
|
L1CAM INTERACTIONS
|
| 0.00e+00
|
0.00e+00
|
INTERACTION BETWEEN L1 AND ANKYRINS
|
| 1.88e-11
|
7.16e-09
|
AXON GUIDANCE
|
| 5.01e-11
|
1.41e-08
|
AXON GUIDANCE
|
| 3.04e-09
|
9.37e-07
|
DEVELOPMENTAL BIOLOGY
|
|
11Nominal enrichment p-value (Wallenius’ noncentral hypergeometric distribution)
2FDR corrected p-value (Benjamini-Hochberg)
Mouse mutant phenotypes
11Nominal enrichment p-value (Wallenius’ noncentral hypergeometric distribution)
2FDR corrected p-value (Benjamini-Hochberg)
Generated on: Thu Aug 30 17:24:27 2018 - R2HTML