Back to main page
DREAM Module Identification Challenge – Consensus modules
PPI-STRING_Consensus_mod47
| Assigned name |
NA |
| Network |
PPI-STRING |
| Module ID |
PPI-STRING_Consensus_mod47 |
| Module size |
28 genes |
|
Module genes
This module comprises the following genes:
| Gene ID |
Gene Symbol |
Gene Name |
| 125981
|
ACER1
|
alkaline ceramidase 1
|
| 340485
|
ACER2
|
alkaline ceramidase 2
|
| 427
|
ASAH1
|
N-acylsphingosine amidohydrolase 1
|
| 56624
|
ASAH2
|
N-acylsphingosine amidohydrolase 2
|
| 64781
|
CERK
|
ceramide kinase
|
| 10715
|
CERS1
|
ceramide synthase 1
|
| 29956
|
CERS2
|
ceramide synthase 2
|
| 204219
|
CERS3
|
ceramide synthase 3
|
| 79603
|
CERS4
|
ceramide synthase 4
|
| 91012
|
CERS5
|
ceramide synthase 5
|
| 253782
|
CERS6
|
ceramide synthase 6
|
| 8560
|
DEGS1
|
delta 4-desaturase, sphingolipid 1
|
| 123099
|
DEGS2
|
delta 4-desaturase, sphingolipid 2
|
| 2581
|
GALC
|
galactosylceramidase
|
| 57704
|
GBA2
|
glucosylceramidase beta 2
|
| 8611
|
PPAP2A
|
phospholipid phosphatase 1
|
| 8613
|
PPAP2B
|
phospholipid phosphatase 3
|
| 8612
|
PPAP2C
|
phospholipid phosphatase 2
|
| 259230
|
SGMS1
|
sphingomyelin synthase 1
|
| 166929
|
SGMS2
|
sphingomyelin synthase 2
|
| 81537
|
SGPP1
|
sphingosine-1-phosphate phosphatase 1
|
| 130367
|
SGPP2
|
sphingosine-1-phosphate phosphatase 2
|
| 6610
|
SMPD2
|
sphingomyelin phosphodiesterase 2
|
| 55512
|
SMPD3
|
sphingomyelin phosphodiesterase 3
|
| 55627
|
SMPD4
|
sphingomyelin phosphodiesterase 4
|
| 8877
|
SPHK1
|
sphingosine kinase 1
|
| 56848
|
SPHK2
|
sphingosine kinase 2
|
| 7368
|
UGT8
|
UDP glycosyltransferase 8
|
|
Functional annotation
Modules were tested for enrichment in functional and pathway annotations using two complementary approaches:
1. To select a small number of specific / non-redundant annotations for each module, a regression-based approach was used;
2. To obtain the complete set of enriched annotations, an extension of Fisher’s exact test that takes annotation bias into account was employed (Wallenius’ non-central hypergeometric distribution).
Most specific annotations for this module
1Regression coefficient
2Fisher’s exact test nominal P-value
3Annotation source (Reactome, GO biological process (BP), molecular function (MF) and cellular component (CC))
4GO category or Reactome pathway
5High-level branch of annotation tree
Gene membership
All enriched annotations
Gene Ontology
11Nominal enrichment p-value (Wallenius’ noncentral hypergeometric distribution)
2FDR corrected p-value (Benjamini-Hochberg)
Reactome
| P-value1 |
FDR2 |
Term |
| 0.00e+00
|
0.00e+00
|
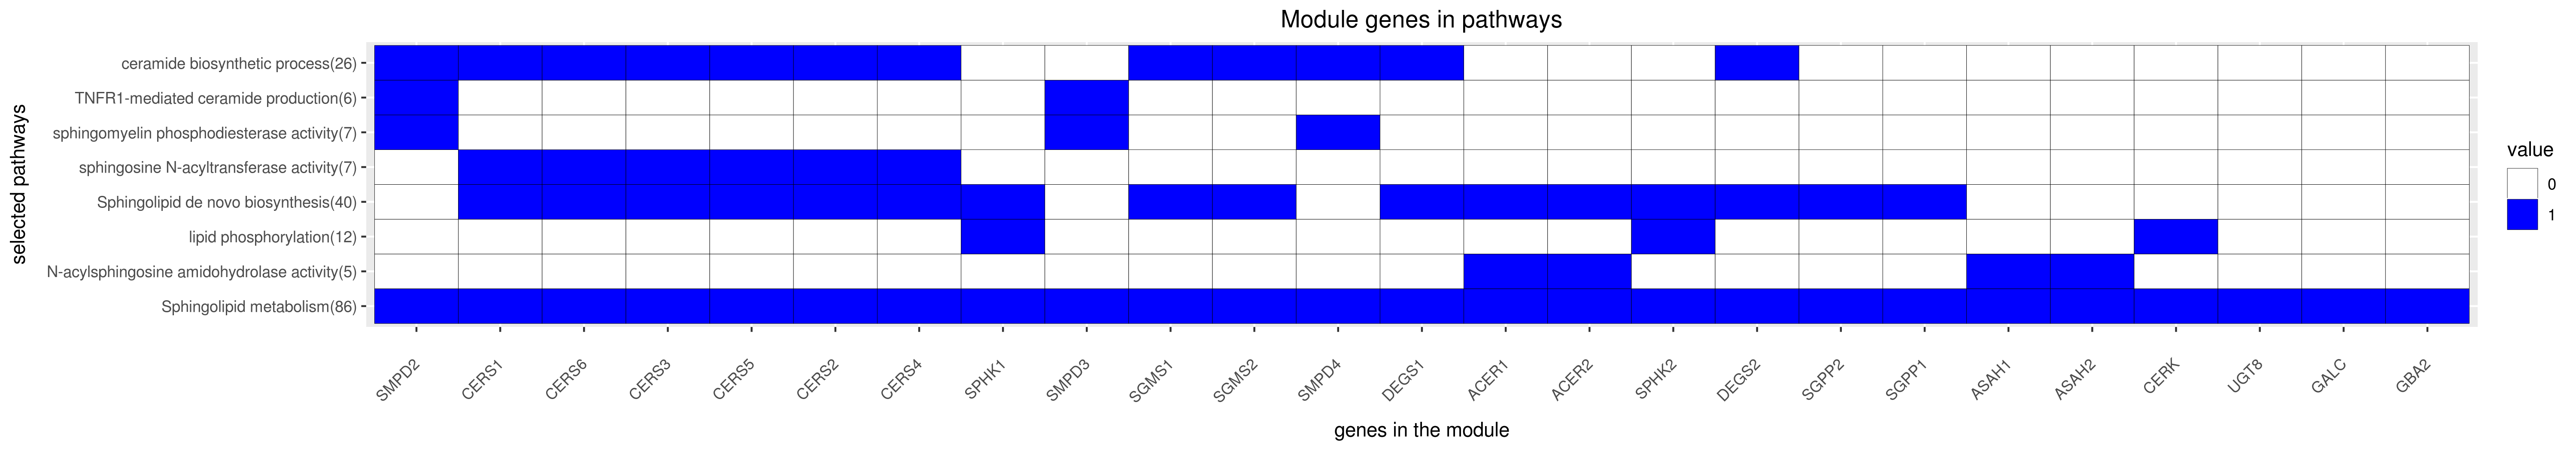
SPHINGOLIPID DE NOVO BIOSYNTHESIS
|
| 0.00e+00
|
0.00e+00
|
PHOSPHOLIPID METABOLISM
|
| 0.00e+00
|
0.00e+00
|
SPHINGOLIPID METABOLISM
|
| 0.00e+00
|
0.00e+00
|
GLYCOSPHINGOLIPID METABOLISM
|
| 0.00e+00
|
0.00e+00
|
SPHINGOLIPID DE NOVO BIOSYNTHESIS
|
| 0.00e+00
|
0.00e+00
|
SPHINGOLIPID METABOLISM
|
| 0.00e+00
|
0.00e+00
|
PHOSPHOLIPID METABOLISM
|
| 2.79e-09
|
6.47e-07
|
GLYCOSPHINGOLIPID METABOLISM
|
| 2.36e-02
|
1.00e+00
|
ASSOCIATION OF TRIC CCT WITH TARGET PROTEINS DURING BIOSYNTHESIS
|
| 4.33e-02
|
1.00e+00
|
PROTEIN FOLDING
|
|
11Nominal enrichment p-value (Wallenius’ noncentral hypergeometric distribution)
2FDR corrected p-value (Benjamini-Hochberg)
Mouse mutant phenotypes
11Nominal enrichment p-value (Wallenius’ noncentral hypergeometric distribution)
2FDR corrected p-value (Benjamini-Hochberg)
Generated on: Thu Aug 30 17:21:59 2018 - R2HTML