Back to main page
DREAM Module Identification Challenge – Consensus modules
PPI-STRING_Consensus_mod45
| Assigned name |
NA |
| Network |
PPI-STRING |
| Module ID |
PPI-STRING_Consensus_mod45 |
| Module size |
28 genes |
|
Module genes
This module comprises the following genes:
| Gene ID |
Gene Symbol |
Gene Name |
| 100362547
|
CHAD
|
adaptor related protein complex 1 subunit gamma 2
|
| 221184
|
CPN2
|
copine 2
|
| 2331
|
FMOD
|
fibromodulin
|
| 2814
|
GP5
|
glycoprotein V platelet
|
| 11081
|
KERA
|
keratocan
|
| 116844
|
LRG1
|
leucine rich alpha-2-glycoprotein 1
|
| 55227
|
LRRC1
|
leucine rich repeat containing 1
|
| 376132
|
LRRC10
|
leucine rich repeat containing 10
|
| 390205
|
LRRC10B
|
leucine rich repeat containing 10B
|
| 474354
|
LRRC18
|
leucine rich repeat containing 18
|
| 79442
|
LRRC2
|
leucine rich repeat containing 2
|
| 55222
|
LRRC20
|
leucine rich repeat containing 20
|
| 10233
|
LRRC23
|
leucine rich repeat containing 23
|
| 123355
|
LRRC28
|
leucine rich repeat containing 28
|
| 339291
|
LRRC30
|
leucine rich repeat containing 30
|
| 127495
|
LRRC39
|
leucine rich repeat containing 39
|
| 55631
|
LRRC40
|
leucine rich repeat containing 40
|
| 255252
|
LRRC57
|
leucine rich repeat containing 57
|
| 116064
|
LRRC58
|
leucine rich repeat containing 58
|
| 55379
|
LRRC59
|
leucine rich repeat containing 59
|
| 100130742
|
LRRC69
|
leucine rich repeat containing 69
|
| 401387
|
LRRD1
|
leucine rich repeats and death domain containing 1
|
| 344657
|
LRRIQ4
|
leucine rich repeats and IQ motif containing 4
|
| 4060
|
LUM
|
lumican
|
| 4969
|
OGN
|
osteoglycin
|
| 4958
|
OMD
|
osteomodulin
|
| 5549
|
PRELP
|
proline and arginine rich end leucine rich repeat protein
|
| 6251
|
RSU1
|
Ras suppressor protein 1
|
|
Functional annotation
Modules were tested for enrichment in functional and pathway annotations using two complementary approaches:
1. To select a small number of specific / non-redundant annotations for each module, a regression-based approach was used;
2. To obtain the complete set of enriched annotations, an extension of Fisher’s exact test that takes annotation bias into account was employed (Wallenius’ non-central hypergeometric distribution).
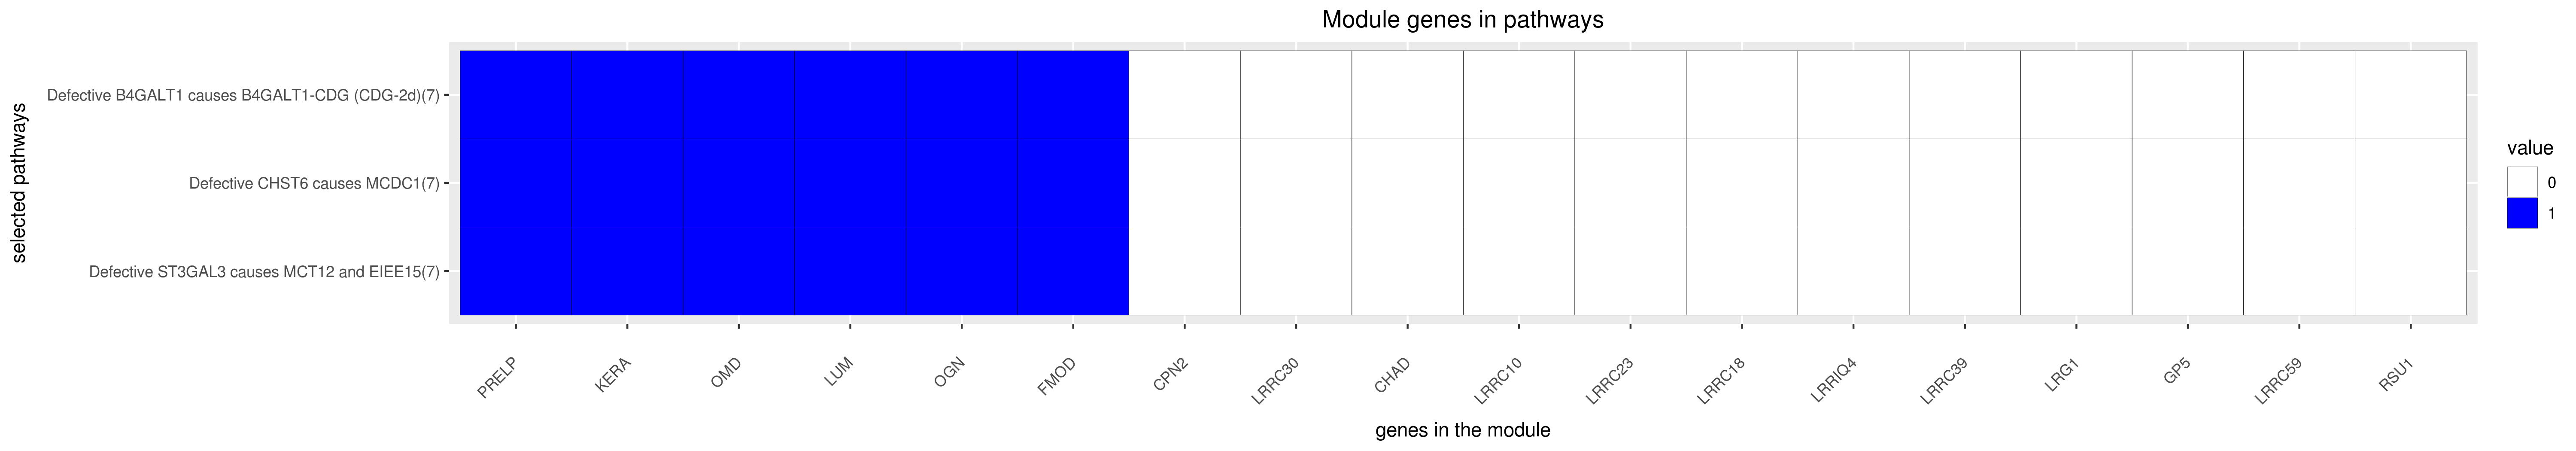
Most specific annotations for this module
1Regression coefficient
2Fisher’s exact test nominal P-value
3Annotation source (Reactome, GO biological process (BP), molecular function (MF) and cellular component (CC))
4GO category or Reactome pathway
5High-level branch of annotation tree
Gene membership
All enriched annotations
Gene Ontology
11Nominal enrichment p-value (Wallenius’ noncentral hypergeometric distribution)
2FDR corrected p-value (Benjamini-Hochberg)
Reactome
| P-value1 |
FDR2 |
Term |
| 0.00e+00
|
0.00e+00
|
KERATAN SULFATE DEGRADATION
|
| 6.90e-12
|
2.03e-09
|
KERATAN SULFATE DEGRADATION
|
| 2.93e-11
|
1.11e-08
|
KERATAN SULFATE BIOSYNTHESIS
|
| 3.21e-11
|
1.21e-08
|
KERATAN SULFATE KERATIN METABOLISM
|
| 3.80e-10
|
9.75e-08
|
KERATAN SULFATE BIOSYNTHESIS
|
| 4.18e-10
|
1.07e-07
|
KERATAN SULFATE KERATIN METABOLISM
|
| 2.97e-08
|
8.23e-06
|
GLYCOSAMINOGLYCAN METABOLISM
|
| 3.20e-08
|
6.67e-06
|
GLYCOSAMINOGLYCAN METABOLISM
|
| 5.54e-07
|
1.30e-04
|
METABOLISM OF CARBOHYDRATES
|
| 6.00e-07
|
1.08e-04
|
METABOLISM OF CARBOHYDRATES
|
| 1.34e-02
|
1.00e+00
|
CELL EXTRACELLULAR MATRIX INTERACTIONS
|
| 2.08e-02
|
1.00e+00
|
CELL EXTRACELLULAR MATRIX INTERACTIONS
|
| 2.21e-02
|
1.00e+00
|
PLATELET ADHESION TO EXPOSED COLLAGEN
|
| 3.89e-02
|
1.00e+00
|
PLATELET AGGREGATION PLUG FORMATION
|
| 4.20e-02
|
1.00e+00
|
INTRINSIC PATHWAY
|
| 4.94e-02
|
1.00e+00
|
PLATELET ADHESION TO EXPOSED COLLAGEN
|
|
11Nominal enrichment p-value (Wallenius’ noncentral hypergeometric distribution)
2FDR corrected p-value (Benjamini-Hochberg)
Mouse mutant phenotypes
11Nominal enrichment p-value (Wallenius’ noncentral hypergeometric distribution)
2FDR corrected p-value (Benjamini-Hochberg)
Generated on: Thu Aug 30 17:21:53 2018 - R2HTML