Back to main page
DREAM Module Identification Challenge – Consensus modules
PPI-STRING_Consensus_mod367
| Assigned name |
NA |
| Network |
PPI-STRING |
| Module ID |
PPI-STRING_Consensus_mod367 |
| Module size |
43 genes |
|
Module genes
This module comprises the following genes:
| Gene ID |
Gene Symbol |
Gene Name |
| 53335
|
BCL11A
|
B cell CLL/lymphoma 11A
|
| 255877
|
BCL6B
|
B cell CLL/lymphoma 6B
|
| 1877
|
E4F1
|
E4F transcription factor 1
|
| 1960
|
EGR3
|
early growth response 3
|
| 2672
|
GFI1
|
growth factor independent 1 transcriptional repressor
|
| 8328
|
GFI1B
|
growth factor independent 1B transcriptional repressor
|
| 3090
|
HIC1
|
HIC ZBTB transcriptional repressor 1
|
| 10661
|
KLF1
|
Kruppel like factor 1
|
| 7071
|
KLF10
|
Kruppel like factor 10
|
| 8462
|
KLF11
|
Kruppel like factor 11
|
| 51621
|
KLF13
|
Kruppel like factor 13
|
| 10365
|
KLF2
|
Kruppel like factor 2
|
| 51274
|
KLF3
|
Kruppel like factor 3
|
| 11279
|
KLF8
|
Kruppel like factor 8
|
| 687
|
KLF9
|
Kruppel like factor 9
|
| 112939
|
NACC1
|
nucleus accumbens associated 1
|
| 138151
|
NACC2
|
NACC family member 2
|
| 23598
|
PATZ1
|
POZ/BTB and AT hook containing zinc finger 1
|
| 11108
|
PRDM4
|
PR/SET domain 4
|
| 11107
|
PRDM5
|
PR/SET domain 5
|
| 29803
|
REPIN1
|
replication initiator 1
|
| 5978
|
REST
|
RE1 silencing transcription factor
|
| 6671
|
SP4
|
Sp4 transcription factor
|
| 126248
|
WDR88
|
WD repeat domain 88
|
| 7709
|
ZBTB17
|
zinc finger and BTB domain containing 17
|
| 27033
|
ZBTB32
|
zinc finger and BTB domain containing 32
|
| 51341
|
ZBTB7A
|
zinc finger and BTB domain containing 7A
|
| 51043
|
ZBTB7B
|
zinc finger and BTB domain containing 7B
|
| 7541
|
ZFP161
|
zinc finger and BTB domain containing 14
|
| 7545
|
ZIC1
|
Zic family member 1
|
| 7690
|
ZNF131
|
zinc finger protein 131
|
| 129025
|
ZNF280A
|
zinc finger protein 280A
|
| 140883
|
ZNF280B
|
zinc finger protein 280B
|
| 55609
|
ZNF280C
|
zinc finger protein 280C
|
| 54816
|
ZNF280D
|
zinc finger protein 280D
|
| 49854
|
ZNF295
|
zinc finger and BTB domain containing 21
|
| 149076
|
ZNF362
|
zinc finger protein 362
|
| 171017
|
ZNF384
|
zinc finger protein 384
|
| 23090
|
ZNF423
|
zinc finger protein 423
|
| 51710
|
ZNF44
|
zinc finger protein 44
|
| 57592
|
ZNF687
|
zinc finger protein 687
|
| 7629
|
ZNF76
|
zinc finger protein 76
|
| 152485
|
ZNF827
|
zinc finger protein 827
|
|
Functional annotation
Modules were tested for enrichment in functional and pathway annotations using two complementary approaches:
1. To select a small number of specific / non-redundant annotations for each module, a regression-based approach was used;
2. To obtain the complete set of enriched annotations, an extension of Fisher’s exact test that takes annotation bias into account was employed (Wallenius’ non-central hypergeometric distribution).
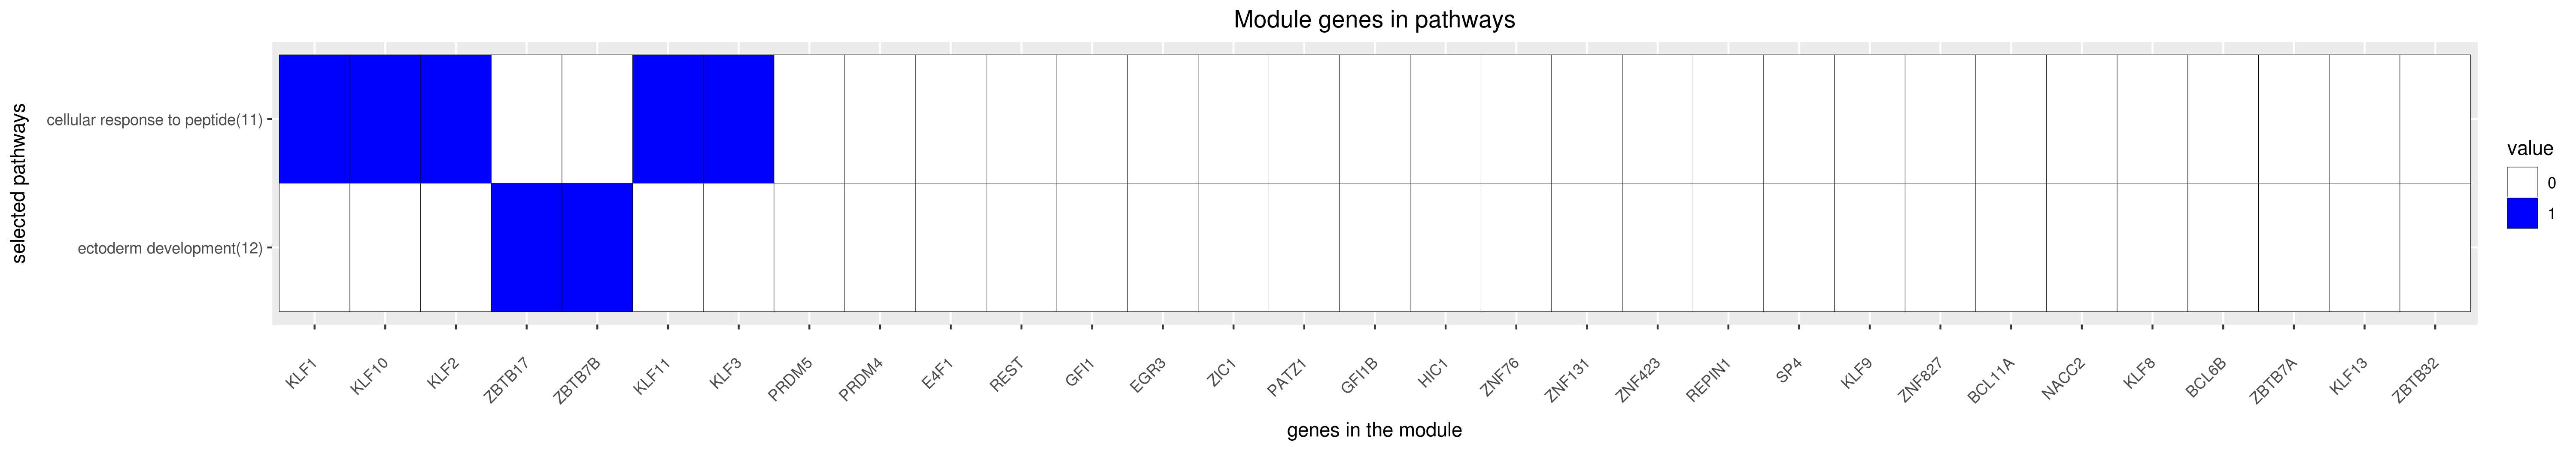
Most specific annotations for this module
1Regression coefficient
2Fisher’s exact test nominal P-value
3Annotation source (Reactome, GO biological process (BP), molecular function (MF) and cellular component (CC))
4GO category or Reactome pathway
5High-level branch of annotation tree
Gene membership
All enriched annotations
Gene Ontology
11Nominal enrichment p-value (Wallenius’ noncentral hypergeometric distribution)
2FDR corrected p-value (Benjamini-Hochberg)
Reactome
| P-value1 |
FDR2 |
Term |
| 5.00e-03
|
4.11e-01
|
REGULATION OF THE FANCONI ANEMIA PATHWAY
|
| 6.14e-03
|
5.41e-01
|
REGULATION OF THE FANCONI ANEMIA PATHWAY
|
| 9.73e-03
|
7.16e-01
|
P75 NTR RECEPTOR MEDIATED SIGNALLING
|
| 1.46e-02
|
9.94e-01
|
SIGNALLING BY NGF
|
| 1.60e-02
|
1.00e+00
|
FANCONI ANEMIA PATHWAY
|
| 2.11e-02
|
1.00e+00
|
P75 NTR RECEPTOR MEDIATED SIGNALLING
|
| 2.64e-02
|
1.00e+00
|
FANCONI ANEMIA PATHWAY
|
| 2.73e-02
|
1.00e+00
|
SIGNALLING BY NGF
|
| 2.80e-02
|
1.00e+00
|
DNA REPAIR
|
| 3.94e-02
|
1.00e+00
|
ACTIVATION OF CHAPERONE GENES BY XBP1S
|
| 4.53e-02
|
1.00e+00
|
UNFOLDED PROTEIN RESPONSE
|
|
11Nominal enrichment p-value (Wallenius’ noncentral hypergeometric distribution)
2FDR corrected p-value (Benjamini-Hochberg)
Mouse mutant phenotypes
11Nominal enrichment p-value (Wallenius’ noncentral hypergeometric distribution)
2FDR corrected p-value (Benjamini-Hochberg)
Generated on: Thu Aug 30 17:37:46 2018 - R2HTML