Back to main page
DREAM Module Identification Challenge – Consensus modules
PPI-STRING_Consensus_mod339
| Assigned name |
NA |
| Network |
PPI-STRING |
| Module ID |
PPI-STRING_Consensus_mod339 |
| Module size |
26 genes |
|
Module genes
This module comprises the following genes:
| Gene ID |
Gene Symbol |
Gene Name |
| 23357
|
ANGEL1
|
angel homolog 1
|
| 90806
|
ANGEL2
|
angel homolog 2
|
| 55571
|
C2orf29
|
CCR4-NOT transcription complex subunit 11
|
| 25819
|
CCRN4L
|
nocturnin
|
| 23019
|
CNOT1
|
CCR4-NOT transcription complex subunit 1
|
| 25904
|
CNOT10
|
CCR4-NOT transcription complex subunit 10
|
| 4848
|
CNOT2
|
CCR4-NOT transcription complex subunit 2
|
| 4849
|
CNOT3
|
CCR4-NOT transcription complex subunit 3
|
| 4850
|
CNOT4
|
CCR4-NOT transcription complex subunit 4
|
| 57472
|
CNOT6
|
CCR4-NOT transcription complex subunit 6
|
| 246175
|
CNOT6L
|
CCR4-NOT transcription complex subunit 6 like
|
| 29883
|
CNOT7
|
CCR4-NOT transcription complex subunit 7
|
| 9337
|
CNOT8
|
CCR4-NOT transcription complex subunit 8
|
| 22849
|
CPEB3
|
cytoplasmic polyadenylation element binding protein 3
|
| 1981
|
EIF4G1
|
eukaryotic translation initiation factor 4 gamma 1
|
| 1982
|
EIF4G2
|
eukaryotic translation initiation factor 4 gamma 2
|
| 10605
|
PAIP1
|
poly(A) binding protein interacting protein 1
|
| 9924
|
PAN2
|
poly(A) specific ribonuclease subunit PAN2
|
| 171389
|
PAN3
|
NLR family pyrin domain containing 6
|
| 54039
|
PCBP3
|
poly(rC) binding protein 3
|
| 57060
|
PCBP4
|
poly(rC) binding protein 4
|
| 79596
|
RNF219
|
ring finger protein 219
|
| 9125
|
RQCD1
|
CCR4-NOT transcription complex subunit 9
|
| 85456
|
TNKS1BP1
|
tankyrase 1 binding protein 1
|
| 10140
|
TOB1
|
transducer of ERBB2, 1
|
| 10766
|
TOB2
|
transducer of ERBB2, 2
|
|
Functional annotation
Modules were tested for enrichment in functional and pathway annotations using two complementary approaches:
1. To select a small number of specific / non-redundant annotations for each module, a regression-based approach was used;
2. To obtain the complete set of enriched annotations, an extension of Fisher’s exact test that takes annotation bias into account was employed (Wallenius’ non-central hypergeometric distribution).
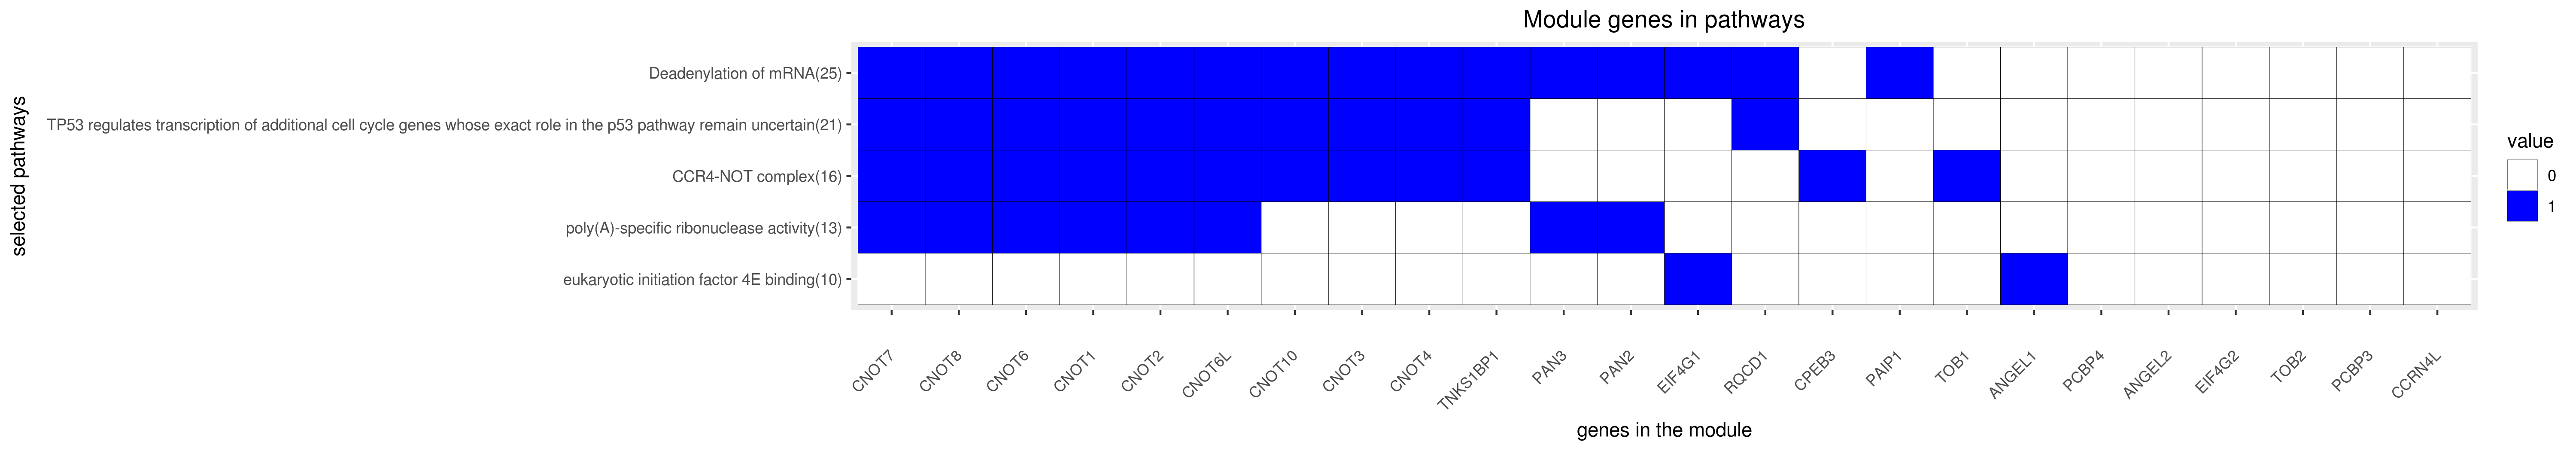
Most specific annotations for this module
1Regression coefficient
2Fisher’s exact test nominal P-value
3Annotation source (Reactome, GO biological process (BP), molecular function (MF) and cellular component (CC))
4GO category or Reactome pathway
5High-level branch of annotation tree
Gene membership
All enriched annotations
Gene Ontology
11Nominal enrichment p-value (Wallenius’ noncentral hypergeometric distribution)
2FDR corrected p-value (Benjamini-Hochberg)
Reactome
| P-value1 |
FDR2 |
Term |
| 0.00e+00
|
0.00e+00
|
DEADENYLATION DEPENDENT MRNA DECAY
|
| 0.00e+00
|
0.00e+00
|
METABOLISM OF RNA
|
| 0.00e+00
|
0.00e+00
|
DEADENYLATION OF MRNA
|
| 0.00e+00
|
0.00e+00
|
METABOLISM OF MRNA
|
| 0.00e+00
|
0.00e+00
|
DEADENYLATION DEPENDENT MRNA DECAY
|
| 0.00e+00
|
0.00e+00
|
METABOLISM OF RNA
|
| 0.00e+00
|
0.00e+00
|
DEADENYLATION OF MRNA
|
| 0.00e+00
|
0.00e+00
|
METABOLISM OF MRNA
|
| 5.88e-03
|
5.23e-01
|
ANTIVIRAL MECHANISM BY IFN STIMULATED GENES
|
| 7.26e-03
|
5.63e-01
|
ANTIVIRAL MECHANISM BY IFN STIMULATED GENES
|
| 1.03e-02
|
8.15e-01
|
MTORC1 MEDIATED SIGNALLING
|
| 1.08e-02
|
7.78e-01
|
MTORC1 MEDIATED SIGNALLING
|
| 1.45e-02
|
9.89e-01
|
PKB MEDIATED EVENTS
|
| 2.05e-02
|
1.00e+00
|
PKB MEDIATED EVENTS
|
| 2.26e-02
|
1.00e+00
|
BMAL1 CLOCK NPAS2 ACTIVATES CIRCADIAN EXPRESSION
|
| 2.38e-02
|
1.00e+00
|
INTERFERON SIGNALING
|
| 3.76e-02
|
1.00e+00
|
NONSENSE MEDIATED DECAY ENHANCED BY THE EXON JUNCTION COMPLEX
|
| 4.24e-02
|
1.00e+00
|
BMAL1 CLOCK NPAS2 ACTIVATES CIRCADIAN EXPRESSION
|
|
11Nominal enrichment p-value (Wallenius’ noncentral hypergeometric distribution)
2FDR corrected p-value (Benjamini-Hochberg)
Mouse mutant phenotypes
11Nominal enrichment p-value (Wallenius’ noncentral hypergeometric distribution)
2FDR corrected p-value (Benjamini-Hochberg)
Generated on: Thu Aug 30 17:36:26 2018 - R2HTML