Back to main page
DREAM Module Identification Challenge – Consensus modules
PPI-STRING_Consensus_mod333
| Assigned name |
NA |
| Network |
PPI-STRING |
| Module ID |
PPI-STRING_Consensus_mod333 |
| Module size |
23 genes |
|
Module genes
This module comprises the following genes:
| Gene ID |
Gene Symbol |
Gene Name |
| 303617
|
DDT
|
bromodomain PHD finger transcription factor
|
| 100037417
|
DDTL
|
D-dopachrome tautomerase like
|
| 27000
|
DNAJC2
|
DnaJ heat shock protein family (Hsp40) member C2
|
| 1797
|
DOM3Z
|
decapping exoribonuclease
|
| 9521
|
EEF1E1
|
eukaryotic translation elongation factor 1 epsilon 1
|
| 1937
|
EEF1G
|
eukaryotic translation elongation factor 1 gamma
|
| 2935
|
GSPT1
|
G1 to S phase transition 1
|
| 23708
|
GSPT2
|
G1 to S phase transition 2
|
| 2953
|
GSTT2
|
glutathione S-transferase theta 2 (gene/pseudogene)
|
| 2954
|
GSTZ1
|
glutathione S-transferase zeta 1
|
| 22927
|
HABP4
|
hyaluronan binding protein 4
|
| 10767
|
HBS1L
|
HBS1 like translational GTPase
|
| 26151
|
NAT9
|
N-acetyltransferase 9 (putative)
|
| 27250
|
PDCD4
|
programmed cell death 4
|
| 53918
|
PELO
|
pelota mRNA surveillance and ribosome rescue factor
|
| 138716
|
RPP25L
|
ribonuclease P/MRP subunit p25 like
|
| 2030
|
SLC29A1
|
solute carrier family 29 member 1 (Augustine blood group)
|
| 3177
|
SLC29A2
|
solute carrier family 29 member 2
|
| 55315
|
SLC29A3
|
solute carrier family 29 member 3
|
| 222962
|
SLC29A4
|
solute carrier family 29 member 4
|
| 163589
|
TDRD5
|
tudor domain containing 5
|
| 221400
|
TDRD6
|
tudor domain containing 6
|
| 9652
|
TTC37
|
tetratricopeptide repeat domain 37
|
|
Functional annotation
Modules were tested for enrichment in functional and pathway annotations using two complementary approaches:
1. To select a small number of specific / non-redundant annotations for each module, a regression-based approach was used;
2. To obtain the complete set of enriched annotations, an extension of Fisher’s exact test that takes annotation bias into account was employed (Wallenius’ non-central hypergeometric distribution).
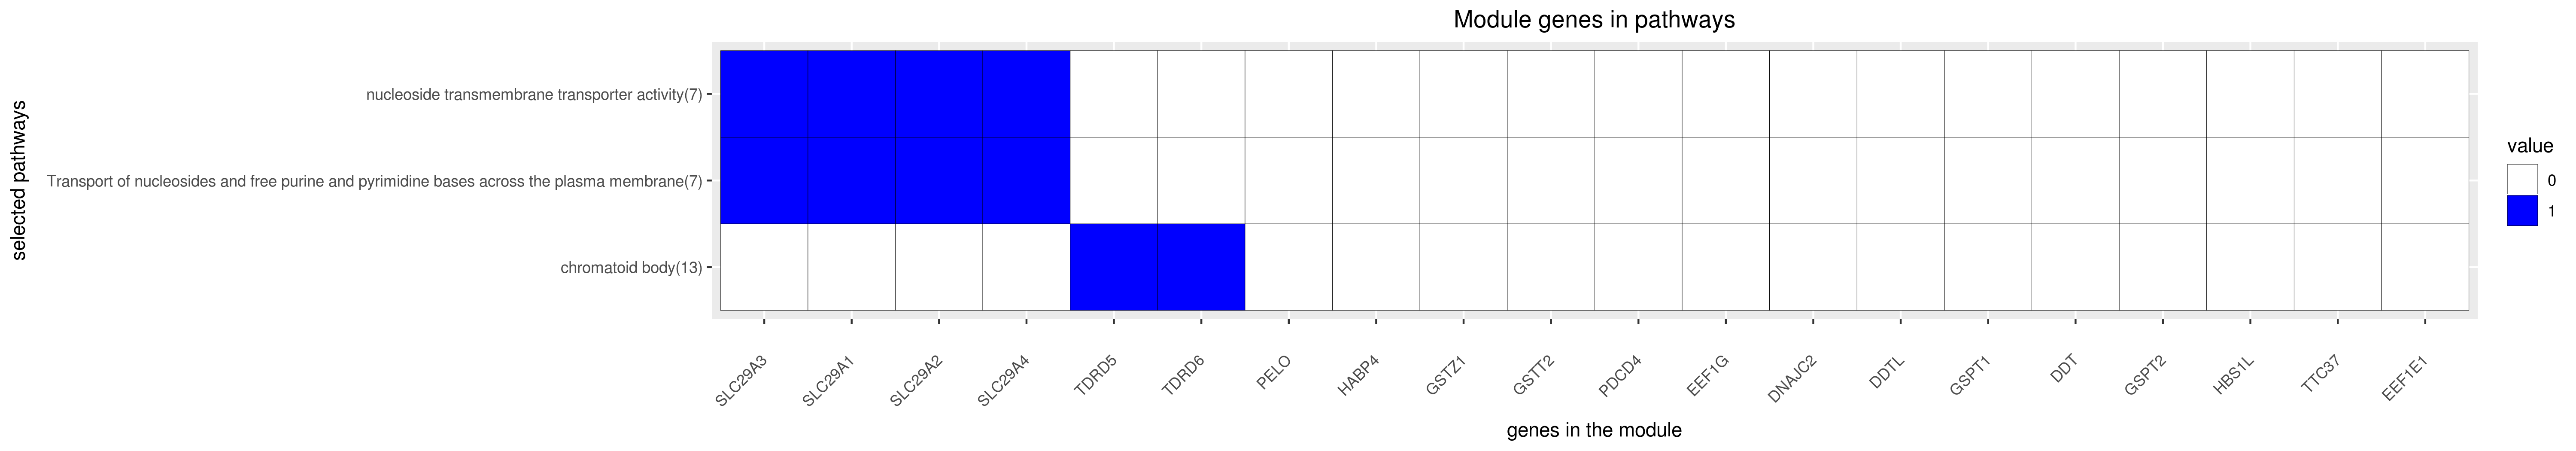
Most specific annotations for this module
1Regression coefficient
2Fisher’s exact test nominal P-value
3Annotation source (Reactome, GO biological process (BP), molecular function (MF) and cellular component (CC))
4GO category or Reactome pathway
5High-level branch of annotation tree
Gene membership
All enriched annotations
Gene Ontology
11Nominal enrichment p-value (Wallenius’ noncentral hypergeometric distribution)
2FDR corrected p-value (Benjamini-Hochberg)
Reactome
| P-value1 |
FDR2 |
Term |
| 1.02e-06
|
2.31e-04
|
TRANSPORT OF VITAMINS NUCLEOSIDES AND RELATED MOLECULES
|
| 1.34e-06
|
2.28e-04
|
TRANSPORT OF VITAMINS NUCLEOSIDES AND RELATED MOLECULES
|
| 3.59e-04
|
4.03e-02
|
SLC MEDIATED TRANSMEMBRANE TRANSPORT
|
| 4.22e-04
|
5.56e-02
|
SLC MEDIATED TRANSMEMBRANE TRANSPORT
|
| 2.55e-03
|
2.62e-01
|
TRANSMEMBRANE TRANSPORT OF SMALL MOLECULES
|
| 2.77e-03
|
2.81e-01
|
TRANSLATION
|
| 3.29e-03
|
2.87e-01
|
NONSENSE MEDIATED DECAY ENHANCED BY THE EXON JUNCTION COMPLEX
|
| 7.08e-03
|
5.53e-01
|
TRANSLATION
|
| 4.24e-02
|
1.00e+00
|
NONSENSE MEDIATED DECAY ENHANCED BY THE EXON JUNCTION COMPLEX
|
| 4.59e-02
|
1.00e+00
|
METABOLISM OF MRNA
|
| 4.66e-02
|
1.00e+00
|
RESPONSE TO ELEVATED PLATELET CYTOSOLIC CA2
|
|
11Nominal enrichment p-value (Wallenius’ noncentral hypergeometric distribution)
2FDR corrected p-value (Benjamini-Hochberg)
Mouse mutant phenotypes
11Nominal enrichment p-value (Wallenius’ noncentral hypergeometric distribution)
2FDR corrected p-value (Benjamini-Hochberg)
Generated on: Thu Aug 30 17:36:09 2018 - R2HTML