Back to main page
DREAM Module Identification Challenge – Consensus modules
PPI-STRING_Consensus_mod306
| Assigned name |
NA |
| Network |
PPI-STRING |
| Module ID |
PPI-STRING_Consensus_mod306 |
| Module size |
28 genes |
|
Module genes
This module comprises the following genes:
| Gene ID |
Gene Symbol |
Gene Name |
| 91304
|
C19orf6
|
transmembrane protein 259
|
| 84536
|
C21orf67
|
long intergenic non-protein coding RNA 1547
|
| 10241
|
CALCOCO2
|
calcium binding and coiled-coil domain 2
|
| 29965
|
CDIP1
|
cell death inducing p53 target 1
|
| 300235
|
DAZAP2
|
DAZ associated protein 2
|
| 54932
|
EXD3
|
exonuclease 3'-5' domain containing 3
|
| 90268
|
FAM105B
|
OTU deubiquitinase with linear linkage specificity
|
| 92689
|
FAM114A1
|
family with sequence similarity 114 member A1
|
| 55603
|
FAM46A
|
terminal nucleotidyltransferase 5A
|
| 60493
|
FASTKD5
|
FAST kinase domains 5
|
| 25758
|
KIAA1549L
|
KIAA1549 like
|
| 115004
|
MB21D1
|
cyclic GMP-AMP synthase
|
| 9683
|
N4BP1
|
NEDD4 binding protein 1
|
| 84166
|
NLRC5
|
NLR family CARD domain containing 5
|
| 729240
|
PRR20C
|
proline rich 20C
|
| 152138
|
PYDC2
|
pyrin domain containing 2
|
| 22864
|
R3HDM2
|
R3H domain containing 2
|
| 6036
|
RNASE2
|
ribonuclease A family member 2
|
| 92014
|
SLC25A51
|
solute carrier family 25 member 51
|
| 200931
|
SLC51A
|
solute carrier family 51 alpha subunit
|
| 123264
|
SLC51B
|
solute carrier family 51 beta subunit
|
| 83985
|
SPIN1
|
sphingolipid transporter 1 (putative)
|
| 342667
|
STAC2
|
SH3 and cysteine rich domain 2
|
| 340061
|
TMEM173
|
transmembrane protein 173
|
| 9537
|
TP53I11
|
tumor protein p53 inducible protein 11
|
| 81844
|
TRIM56
|
tripartite motif containing 56
|
| 7105
|
TSPAN6
|
tetraspanin 6
|
| 23060
|
ZNF609
|
zinc finger protein 609
|
|
Functional annotation
Modules were tested for enrichment in functional and pathway annotations using two complementary approaches:
1. To select a small number of specific / non-redundant annotations for each module, a regression-based approach was used;
2. To obtain the complete set of enriched annotations, an extension of Fisher’s exact test that takes annotation bias into account was employed (Wallenius’ non-central hypergeometric distribution).
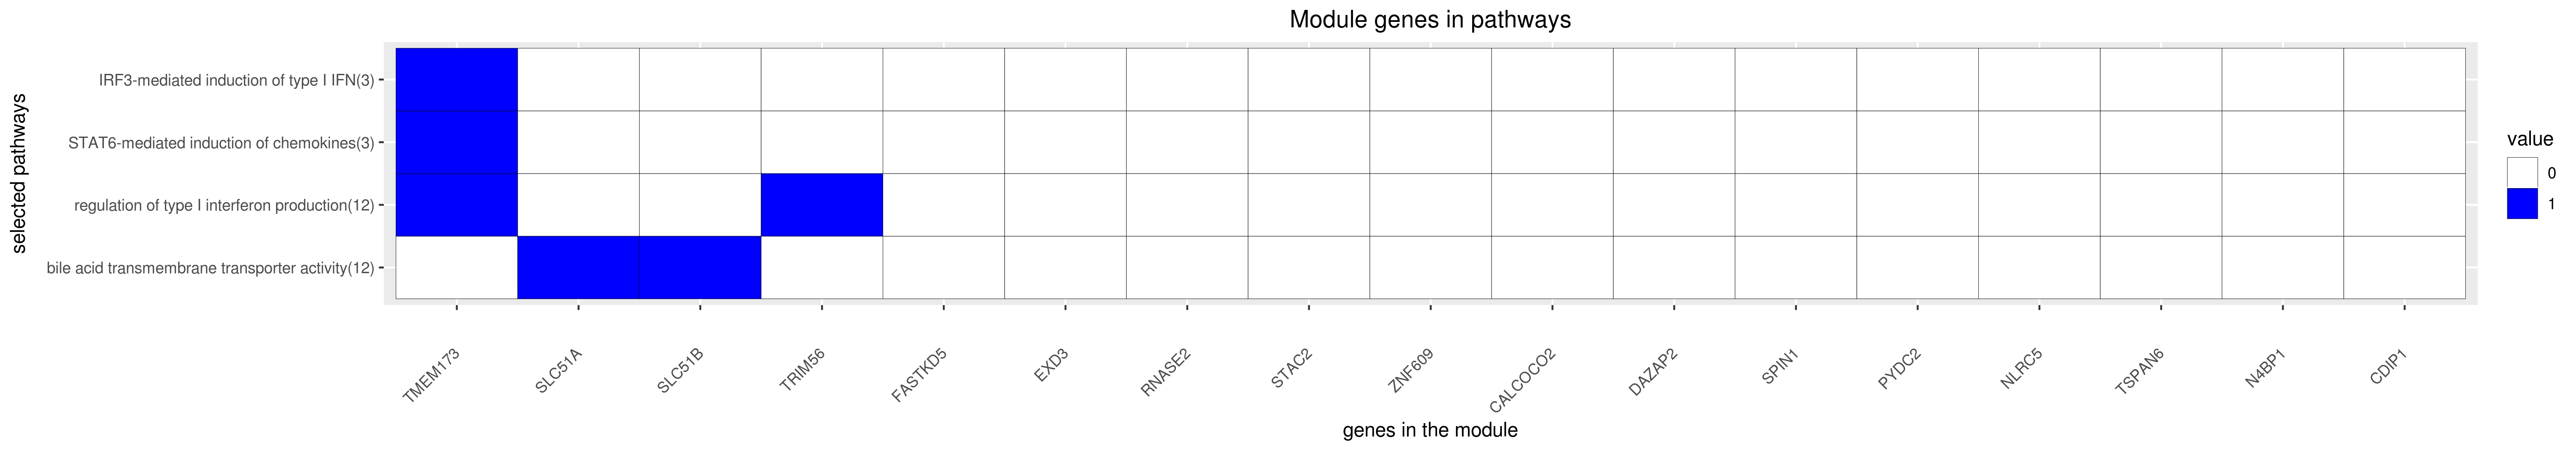
Most specific annotations for this module
1Regression coefficient
2Fisher’s exact test nominal P-value
3Annotation source (Reactome, GO biological process (BP), molecular function (MF) and cellular component (CC))
4GO category or Reactome pathway
5High-level branch of annotation tree
Gene membership
All enriched annotations
Gene Ontology
11Nominal enrichment p-value (Wallenius’ noncentral hypergeometric distribution)
2FDR corrected p-value (Benjamini-Hochberg)
Reactome
| P-value1 |
FDR2 |
Term |
| 2.15e-03
|
2.27e-01
|
NEGATIVE REGULATORS OF RIG I MDA5 SIGNALING
|
| 3.24e-03
|
3.21e-01
|
RIG I MDA5 MEDIATED INDUCTION OF IFN ALPHA BETA PATHWAYS
|
| 2.57e-02
|
1.00e+00
|
INNATE IMMUNE SYSTEM
|
|
11Nominal enrichment p-value (Wallenius’ noncentral hypergeometric distribution)
2FDR corrected p-value (Benjamini-Hochberg)
Mouse mutant phenotypes
11Nominal enrichment p-value (Wallenius’ noncentral hypergeometric distribution)
2FDR corrected p-value (Benjamini-Hochberg)
Generated on: Thu Aug 30 17:34:49 2018 - R2HTML