Back to main page
DREAM Module Identification Challenge – Consensus modules
PPI-STRING_Consensus_mod294
| Assigned name |
NA |
| Network |
PPI-STRING |
| Module ID |
PPI-STRING_Consensus_mod294 |
| Module size |
27 genes |
|
Module genes
This module comprises the following genes:
| Gene ID |
Gene Symbol |
Gene Name |
| 112268437
|
AAK1
|
uncharacterized protein FLJ45252
|
| 55589
|
BMP2K
|
BMP2 inducible kinase
|
| 54108
|
CHRAC1
|
chromatin accessibility complex subunit 1
|
| 23002
|
DAAM1
|
dishevelled associated activator of morphogenesis 1
|
| 23500
|
DAAM2
|
dishevelled associated activator of morphogenesis 2
|
| 414301
|
DDI1
|
DNA damage inducible 1 homolog 1
|
| 84301
|
DDI2
|
DNA damage inducible 1 homolog 2
|
| 2820
|
GPD2
|
glycerol-3-phosphate dehydrogenase 2
|
| 3850
|
KRT3
|
keratin 3
|
| 51350
|
KRT76
|
keratin 76
|
| 23175
|
LPIN1
|
lipin 1
|
| 9663
|
LPIN2
|
lipin 2
|
| 64900
|
LPIN3
|
lipin 3
|
| 360505
|
NPR3
|
NPR3-like, GATOR1 complex subunit
|
| 83714
|
NRIP2
|
nuclear receptor interacting protein 2
|
| 56675
|
NRIP3
|
nuclear receptor interacting protein 3
|
| 55361
|
PI4K2A
|
phosphatidylinositol 4-kinase type 2 alpha
|
| 55300
|
PI4K2B
|
phosphatidylinositol 4-kinase type 2 beta
|
| 5306
|
PITPNA
|
phosphatidylinositol transfer protein alpha
|
| 23760
|
PITPNB
|
phosphatidylinositol transfer protein beta
|
| 26207
|
PITPNC1
|
phosphatidylinositol transfer protein cytoplasmic 1
|
| 9600
|
PITPNM1
|
phosphatidylinositol transfer protein membrane associated 1
|
| 57605
|
PITPNM2
|
phosphatidylinositol transfer protein membrane associated 2
|
| 83394
|
PITPNM3
|
PITPNM family member 3
|
| 375775
|
PNPLA7
|
patatin like phospholipase domain containing 7
|
| 387893
|
SETD8
|
lysine methyltransferase 5A
|
| 7227
|
TRPS1
|
transcriptional repressor GATA binding 1
|
|
Functional annotation
Modules were tested for enrichment in functional and pathway annotations using two complementary approaches:
1. To select a small number of specific / non-redundant annotations for each module, a regression-based approach was used;
2. To obtain the complete set of enriched annotations, an extension of Fisher’s exact test that takes annotation bias into account was employed (Wallenius’ non-central hypergeometric distribution).
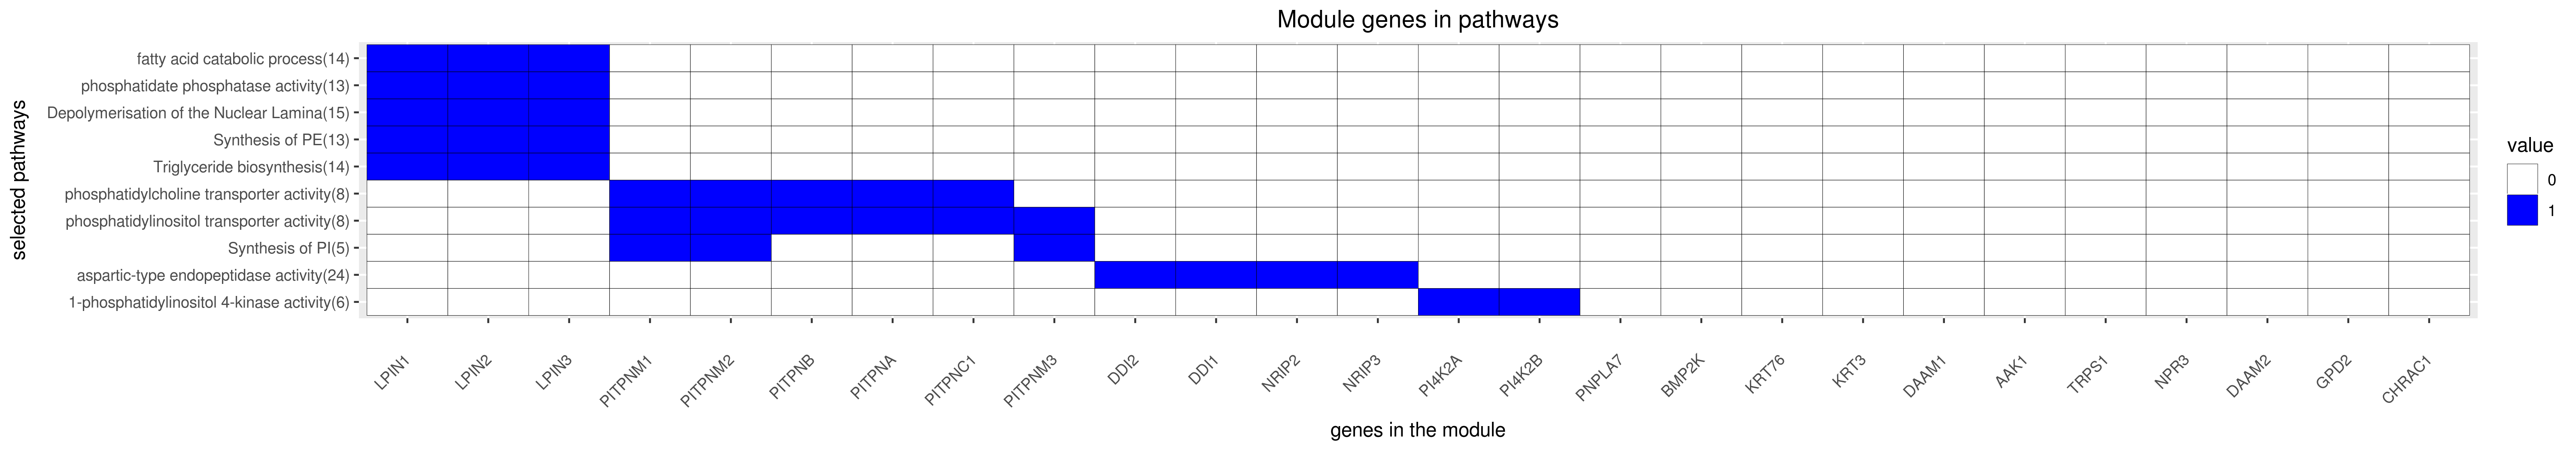
Most specific annotations for this module
1Regression coefficient
2Fisher’s exact test nominal P-value
3Annotation source (Reactome, GO biological process (BP), molecular function (MF) and cellular component (CC))
4GO category or Reactome pathway
5High-level branch of annotation tree
Gene membership
All enriched annotations
Gene Ontology
11Nominal enrichment p-value (Wallenius’ noncentral hypergeometric distribution)
2FDR corrected p-value (Benjamini-Hochberg)
Reactome
| P-value1 |
FDR2 |
Term |
| 1.56e-06
|
3.41e-04
|
PHOSPHOLIPID METABOLISM
|
| 2.33e-06
|
3.82e-04
|
PHOSPHOLIPID METABOLISM
|
| 3.09e-06
|
4.98e-04
|
SYNTHESIS OF PE
|
| 3.47e-06
|
7.14e-04
|
SYNTHESIS OF PE
|
| 1.09e-05
|
2.08e-03
|
SYNTHESIS OF PC
|
| 1.93e-05
|
3.50e-03
|
GLYCEROPHOSPHOLIPID BIOSYNTHESIS
|
| 5.92e-05
|
7.85e-03
|
SYNTHESIS OF PC
|
| 6.32e-05
|
8.35e-03
|
GLYCEROPHOSPHOLIPID BIOSYNTHESIS
|
| 8.79e-05
|
1.13e-02
|
PI METABOLISM
|
| 1.33e-04
|
2.00e-02
|
FATTY ACID TRIACYLGLYCEROL AND KETONE BODY METABOLISM
|
| 1.62e-04
|
2.39e-02
|
PI METABOLISM
|
| 1.66e-04
|
2.44e-02
|
TRIGLYCERIDE BIOSYNTHESIS
|
| 3.27e-04
|
3.71e-02
|
FATTY ACID TRIACYLGLYCEROL AND KETONE BODY METABOLISM
|
| 5.27e-04
|
5.70e-02
|
TRIGLYCERIDE BIOSYNTHESIS
|
| 6.73e-04
|
8.33e-02
|
SYNTHESIS OF PIPS AT THE EARLY ENDOSOME MEMBRANE
|
| 6.77e-04
|
8.37e-02
|
SYNTHESIS OF PIPS AT THE GOLGI MEMBRANE
|
| 1.14e-03
|
1.13e-01
|
SYNTHESIS OF PIPS AT THE EARLY ENDOSOME MEMBRANE
|
| 1.22e-03
|
1.20e-01
|
SYNTHESIS OF PIPS AT THE GOLGI MEMBRANE
|
| 1.30e-03
|
1.27e-01
|
SYNTHESIS OF PIPS AT THE PLASMA MEMBRANE
|
| 1.74e-03
|
1.89e-01
|
SYNTHESIS OF PIPS AT THE PLASMA MEMBRANE
|
|
11Nominal enrichment p-value (Wallenius’ noncentral hypergeometric distribution)
2FDR corrected p-value (Benjamini-Hochberg)
Mouse mutant phenotypes
11Nominal enrichment p-value (Wallenius’ noncentral hypergeometric distribution)
2FDR corrected p-value (Benjamini-Hochberg)
Generated on: Thu Aug 30 17:34:13 2018 - R2HTML