Back to main page
DREAM Module Identification Challenge – Consensus modules
PPI-STRING_Consensus_mod292
| Assigned name |
NA |
| Network |
PPI-STRING |
| Module ID |
PPI-STRING_Consensus_mod292 |
| Module size |
22 genes |
|
Module genes
This module comprises the following genes:
| Gene ID |
Gene Symbol |
Gene Name |
| 479
|
ATP12A
|
ATPase H+/K+ transporting non-gastric alpha2 subunit
|
| 57130
|
ATP13A1
|
ATPase 13A1
|
| 487
|
ATP2A1
|
ATPase sarcoplasmic/endoplasmic reticulum Ca2+ transporting 1
|
| 488
|
ATP2A2
|
ATPase sarcoplasmic/endoplasmic reticulum Ca2+ transporting 2
|
| 489
|
ATP2A3
|
ATPase sarcoplasmic/endoplasmic reticulum Ca2+ transporting 3
|
| 490
|
ATP2B1
|
ATPase plasma membrane Ca2+ transporting 1
|
| 491
|
ATP2B2
|
ATPase plasma membrane Ca2+ transporting 2
|
| 492
|
ATP2B3
|
ATPase plasma membrane Ca2+ transporting 3
|
| 493
|
ATP2B4
|
ATPase plasma membrane Ca2+ transporting 4
|
| 27032
|
ATP2C1
|
ATPase secretory pathway Ca2+ transporting 1
|
| 9914
|
ATP2C2
|
ATPase secretory pathway Ca2+ transporting 2
|
| 495
|
ATP4A
|
ATPase H+/K+ transporting subunit alpha
|
| 496
|
ATP4B
|
ATPase H+/K+ transporting subunit beta
|
| 152078
|
C3orf55
|
PQ loop repeat containing 2 like
|
| 54097
|
FAM3B
|
family with sequence similarity 3 member B
|
| 93210
|
PGAP3
|
post-GPI attachment to proteins 3
|
| 5350
|
PLN
|
phospholamban
|
| 54896
|
PQLC2
|
PQ loop repeat containing 2
|
| 80024
|
SLC24A6
|
solute carrier family 8 member B1
|
| 55334
|
SLC39A9
|
solute carrier family 39 member 9
|
| 6547
|
SLC8A3
|
solute carrier family 8 member A3
|
| 6588
|
SLN
|
sarcolipin
|
|
Functional annotation
Modules were tested for enrichment in functional and pathway annotations using two complementary approaches:
1. To select a small number of specific / non-redundant annotations for each module, a regression-based approach was used;
2. To obtain the complete set of enriched annotations, an extension of Fisher’s exact test that takes annotation bias into account was employed (Wallenius’ non-central hypergeometric distribution).
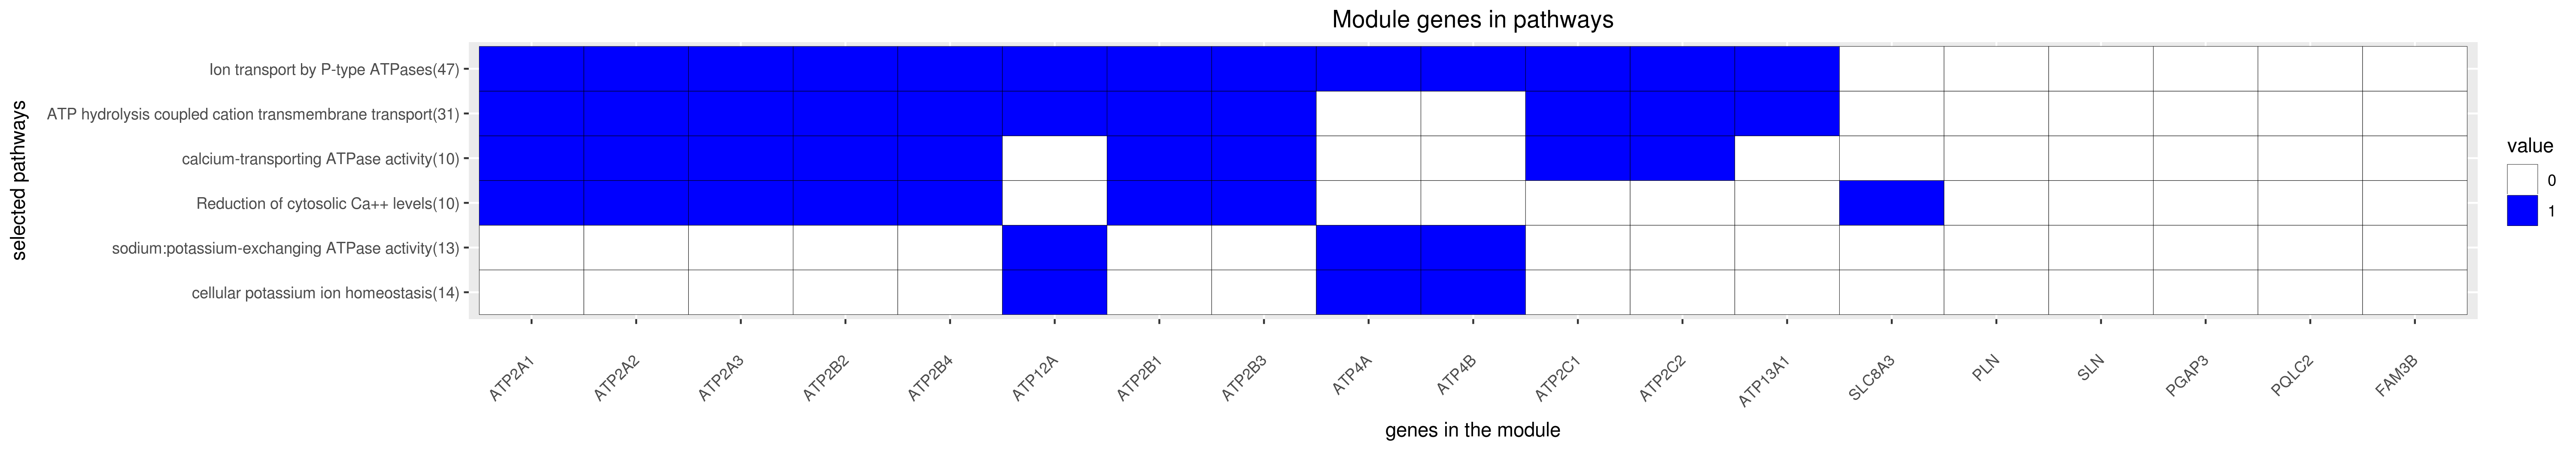
Most specific annotations for this module
1Regression coefficient
2Fisher’s exact test nominal P-value
3Annotation source (Reactome, GO biological process (BP), molecular function (MF) and cellular component (CC))
4GO category or Reactome pathway
5High-level branch of annotation tree
Gene membership
All enriched annotations
Gene Ontology
11Nominal enrichment p-value (Wallenius’ noncentral hypergeometric distribution)
2FDR corrected p-value (Benjamini-Hochberg)
Reactome
| P-value1 |
FDR2 |
Term |
| 0.00e+00
|
0.00e+00
|
TRANSMEMBRANE TRANSPORT OF SMALL MOLECULES
|
| 0.00e+00
|
0.00e+00
|
PLATELET CALCIUM HOMEOSTASIS
|
| 0.00e+00
|
0.00e+00
|
ION CHANNEL TRANSPORT
|
| 0.00e+00
|
0.00e+00
|
ION TRANSPORT BY P TYPE ATPASES
|
| 0.00e+00
|
0.00e+00
|
ION CHANNEL TRANSPORT
|
| 0.00e+00
|
0.00e+00
|
ION TRANSPORT BY P TYPE ATPASES
|
| 1.73e-12
|
5.11e-10
|
PLATELET CALCIUM HOMEOSTASIS
|
| 1.21e-09
|
2.92e-07
|
PLATELET HOMEOSTASIS
|
| 1.85e-09
|
5.90e-07
|
PLATELET HOMEOSTASIS
|
| 8.36e-06
|
1.26e-03
|
PRE NOTCH PROCESSING IN GOLGI
|
| 1.13e-05
|
2.14e-03
|
PRE NOTCH PROCESSING IN GOLGI
|
| 5.62e-05
|
9.29e-03
|
PRE NOTCH EXPRESSION AND PROCESSING
|
| 5.80e-05
|
7.71e-03
|
PRE NOTCH EXPRESSION AND PROCESSING
|
| 3.51e-04
|
3.95e-02
|
SIGNALING BY NOTCH
|
| 7.57e-04
|
9.21e-02
|
SIGNALING BY NOTCH
|
| 2.24e-02
|
1.00e+00
|
TRANSPORT OF INORGANIC CATIONS ANIONS AND AMINO ACIDS OLIGOPEPTIDES
|
| 4.44e-02
|
1.00e+00
|
TRANSPORT OF INORGANIC CATIONS ANIONS AND AMINO ACIDS OLIGOPEPTIDES
|
|
11Nominal enrichment p-value (Wallenius’ noncentral hypergeometric distribution)
2FDR corrected p-value (Benjamini-Hochberg)
Mouse mutant phenotypes
11Nominal enrichment p-value (Wallenius’ noncentral hypergeometric distribution)
2FDR corrected p-value (Benjamini-Hochberg)
Generated on: Thu Aug 30 17:34:08 2018 - R2HTML