Back to main page
DREAM Module Identification Challenge – Consensus modules
PPI-STRING_Consensus_mod246
| Assigned name |
NA |
| Network |
PPI-STRING |
| Module ID |
PPI-STRING_Consensus_mod246 |
| Module size |
28 genes |
|
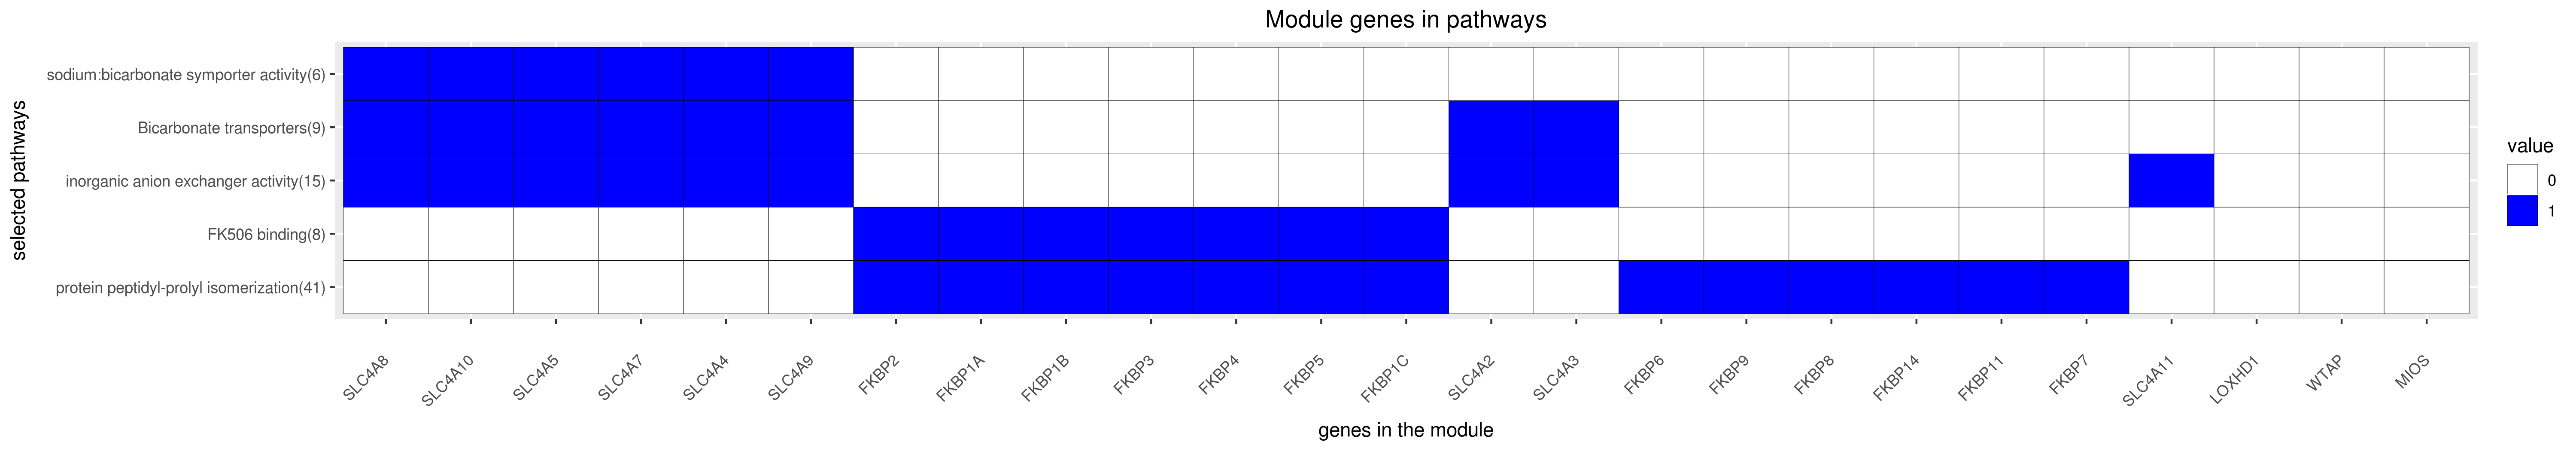
Module genes
This module comprises the following genes:
| Gene ID |
Gene Symbol |
Gene Name |
| 400073
|
C12orf76
|
chromosome 12 open reading frame 76
|
| 60681
|
FKBP10
|
FK506 binding protein 10
|
| 51303
|
FKBP11
|
FK506 binding protein 11
|
| 55033
|
FKBP14
|
FK506 binding protein 14
|
| 2280
|
FKBP1A
|
FK506 binding protein 1A
|
| 2281
|
FKBP1B
|
FK506 binding protein 1B
|
| NA
|
FKBP1C
|
|
| 2286
|
FKBP2
|
FK506 binding protein 2
|
| 2287
|
FKBP3
|
FK506 binding protein 3
|
| 63943
|
FKBP4
|
FK506 binding protein like
|
| 2289
|
FKBP5
|
FK506 binding protein 5
|
| 8468
|
FKBP6
|
FK506 binding protein 6
|
| 51661
|
FKBP7
|
FK506 binding protein 7
|
| 23770
|
FKBP8
|
FK506 binding protein 8
|
| 2281
|
FKBP9
|
FK506 binding protein 1B
|
| 125336
|
LOXHD1
|
lipoxygenase homology domains 1
|
| 54468
|
MIOS
|
meiosis regulator for oocyte development
|
| 152518
|
NFXL1
|
nuclear transcription factor, X-box binding like 1
|
| 57282
|
SLC4A10
|
solute carrier family 4 member 10
|
| 83959
|
SLC4A11
|
solute carrier family 4 member 11
|
| 6522
|
SLC4A2
|
solute carrier family 4 member 2
|
| 6508
|
SLC4A3
|
solute carrier family 4 member 3
|
| 8671
|
SLC4A4
|
solute carrier family 4 member 4
|
| 57835
|
SLC4A5
|
solute carrier family 4 member 5
|
| 9497
|
SLC4A7
|
solute carrier family 4 member 7
|
| 9498
|
SLC4A8
|
solute carrier family 4 member 8
|
| 83697
|
SLC4A9
|
solute carrier family 4 member 9
|
| 9589
|
WTAP
|
WT1 associated protein
|
|
Functional annotation
Modules were tested for enrichment in functional and pathway annotations using two complementary approaches:
1. To select a small number of specific / non-redundant annotations for each module, a regression-based approach was used;
2. To obtain the complete set of enriched annotations, an extension of Fisher’s exact test that takes annotation bias into account was employed (Wallenius’ non-central hypergeometric distribution).
Most specific annotations for this module
1Regression coefficient
2Fisher’s exact test nominal P-value
3Annotation source (Reactome, GO biological process (BP), molecular function (MF) and cellular component (CC))
4GO category or Reactome pathway
5High-level branch of annotation tree
Gene membership
All enriched annotations
Gene Ontology
11Nominal enrichment p-value (Wallenius’ noncentral hypergeometric distribution)
2FDR corrected p-value (Benjamini-Hochberg)
Reactome
| P-value1 |
FDR2 |
Term |
| 1.94e-09
|
4.58e-07
|
TRANSPORT OF INORGANIC CATIONS ANIONS AND AMINO ACIDS OLIGOPEPTIDES
|
| 2.42e-09
|
7.57e-07
|
TRANSPORT OF INORGANIC CATIONS ANIONS AND AMINO ACIDS OLIGOPEPTIDES
|
| 1.98e-07
|
3.74e-05
|
SLC MEDIATED TRANSMEMBRANE TRANSPORT
|
| 2.62e-07
|
6.42e-05
|
SLC MEDIATED TRANSMEMBRANE TRANSPORT
|
| 9.57e-06
|
1.84e-03
|
TRANSMEMBRANE TRANSPORT OF SMALL MOLECULES
|
| 9.90e-03
|
7.27e-01
|
TGF BETA RECEPTOR SIGNALING IN EMT EPITHELIAL TO MESENCHYMAL TRANSITION
|
| 1.09e-02
|
8.53e-01
|
TGF BETA RECEPTOR SIGNALING IN EMT EPITHELIAL TO MESENCHYMAL TRANSITION
|
| 1.50e-02
|
1.00e+00
|
TGF BETA RECEPTOR SIGNALING ACTIVATES SMADS
|
| 2.07e-02
|
1.00e+00
|
TGF BETA RECEPTOR SIGNALING ACTIVATES SMADS
|
| 3.19e-02
|
1.00e+00
|
MEIOTIC SYNAPSIS
|
| 3.49e-02
|
1.00e+00
|
MEIOTIC SYNAPSIS
|
| 3.96e-02
|
1.00e+00
|
SIGNALING BY TGF BETA RECEPTOR COMPLEX
|
| 4.03e-02
|
1.00e+00
|
SIGNALING BY TGF BETA RECEPTOR COMPLEX
|
|
11Nominal enrichment p-value (Wallenius’ noncentral hypergeometric distribution)
2FDR corrected p-value (Benjamini-Hochberg)
Mouse mutant phenotypes
11Nominal enrichment p-value (Wallenius’ noncentral hypergeometric distribution)
2FDR corrected p-value (Benjamini-Hochberg)
Generated on: Thu Aug 30 17:31:53 2018 - R2HTML