Back to main page
DREAM Module Identification Challenge – Consensus modules
PPI-STRING_Consensus_mod245
| Assigned name |
NA |
| Network |
PPI-STRING |
| Module ID |
PPI-STRING_Consensus_mod245 |
| Module size |
16 genes |
|
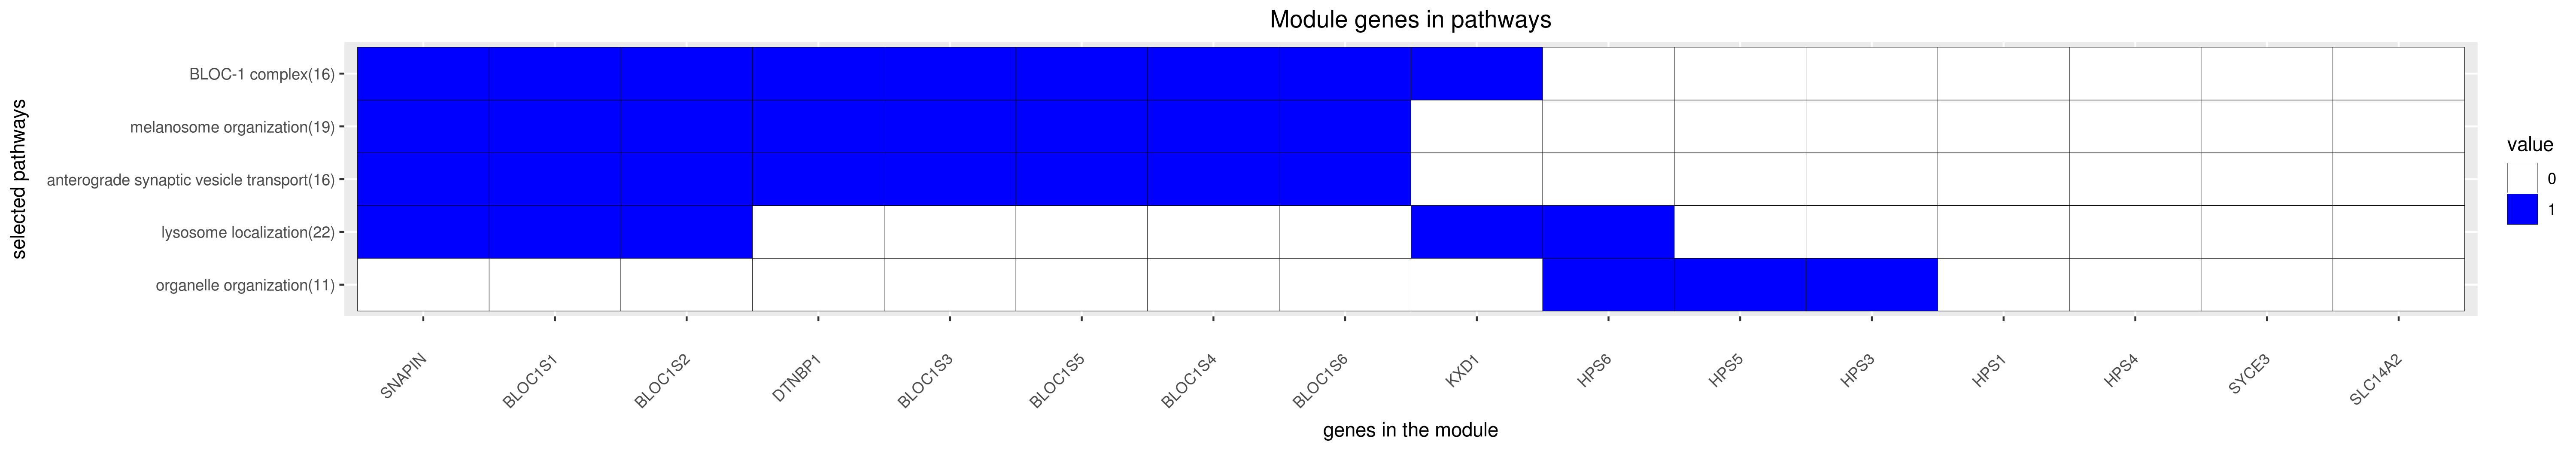
Module genes
This module comprises the following genes:
| Gene ID |
Gene Symbol |
Gene Name |
| 2647
|
BLOC1S1
|
biogenesis of lysosomal organelles complex 1 subunit 1
|
| 282991
|
BLOC1S2
|
biogenesis of lysosomal organelles complex 1 subunit 2
|
| 388552
|
BLOC1S3
|
biogenesis of lysosomal organelles complex 1 subunit 3
|
| 55330
|
BLOC1S4
|
biogenesis of lysosomal organelles complex 1 subunit 4
|
| 63915
|
BLOC1S5
|
biogenesis of lysosomal organelles complex 1 subunit 5
|
| 26258
|
BLOC1S6
|
biogenesis of lysosomal organelles complex 1 subunit 6
|
| 84062
|
DTNBP1
|
dystrobrevin binding protein 1
|
| 3257
|
HPS1
|
HPS1, biogenesis of lysosomal organelles complex 3 subunit 1
|
| 84343
|
HPS3
|
HPS3, biogenesis of lysosomal organelles complex 2 subunit 1
|
| 89781
|
HPS4
|
HPS4, biogenesis of lysosomal organelles complex 3 subunit 2
|
| 11234
|
HPS5
|
HPS5, biogenesis of lysosomal organelles complex 2 subunit 2
|
| 79803
|
HPS6
|
HPS6, biogenesis of lysosomal organelles complex 2 subunit 3
|
| 79036
|
KXD1
|
KxDL motif containing 1
|
| 8170
|
SLC14A2
|
solute carrier family 14 member 2
|
| 23557
|
SNAPIN
|
SNAP associated protein
|
| 644186
|
SYCE3
|
synaptonemal complex central element protein 3
|
|
Functional annotation
Modules were tested for enrichment in functional and pathway annotations using two complementary approaches:
1. To select a small number of specific / non-redundant annotations for each module, a regression-based approach was used;
2. To obtain the complete set of enriched annotations, an extension of Fisher’s exact test that takes annotation bias into account was employed (Wallenius’ non-central hypergeometric distribution).
Most specific annotations for this module
1Regression coefficient
2Fisher’s exact test nominal P-value
3Annotation source (Reactome, GO biological process (BP), molecular function (MF) and cellular component (CC))
4GO category or Reactome pathway
5High-level branch of annotation tree
Gene membership
All enriched annotations
Gene Ontology
11Nominal enrichment p-value (Wallenius’ noncentral hypergeometric distribution)
2FDR corrected p-value (Benjamini-Hochberg)
Reactome
| P-value1 |
FDR2 |
Term |
| 2.31e-07
|
5.71e-05
|
GOLGI ASSOCIATED VESICLE BIOGENESIS
|
| 3.49e-07
|
8.38e-05
|
TRANS GOLGI NETWORK VESICLE BUDDING
|
| 6.24e-07
|
1.12e-04
|
GOLGI ASSOCIATED VESICLE BIOGENESIS
|
| 1.05e-06
|
1.81e-04
|
TRANS GOLGI NETWORK VESICLE BUDDING
|
| 6.28e-06
|
1.24e-03
|
MEMBRANE TRAFFICKING
|
| 6.85e-06
|
1.05e-03
|
MEMBRANE TRAFFICKING
|
| 7.26e-03
|
6.18e-01
|
AMINE COMPOUND SLC TRANSPORTERS
|
| 9.66e-03
|
7.80e-01
|
LYSOSOME VESICLE BIOGENESIS
|
| 1.80e-02
|
1.00e+00
|
AMINE COMPOUND SLC TRANSPORTERS
|
| 1.80e-02
|
1.00e+00
|
LYSOSOME VESICLE BIOGENESIS
|
|
11Nominal enrichment p-value (Wallenius’ noncentral hypergeometric distribution)
2FDR corrected p-value (Benjamini-Hochberg)
Mouse mutant phenotypes
11Nominal enrichment p-value (Wallenius’ noncentral hypergeometric distribution)
2FDR corrected p-value (Benjamini-Hochberg)
Generated on: Thu Aug 30 17:31:50 2018 - R2HTML