Back to main page
DREAM Module Identification Challenge – Consensus modules
PPI-STRING_Consensus_mod242
| Assigned name |
NA |
| Network |
PPI-STRING |
| Module ID |
PPI-STRING_Consensus_mod242 |
| Module size |
59 genes |
|
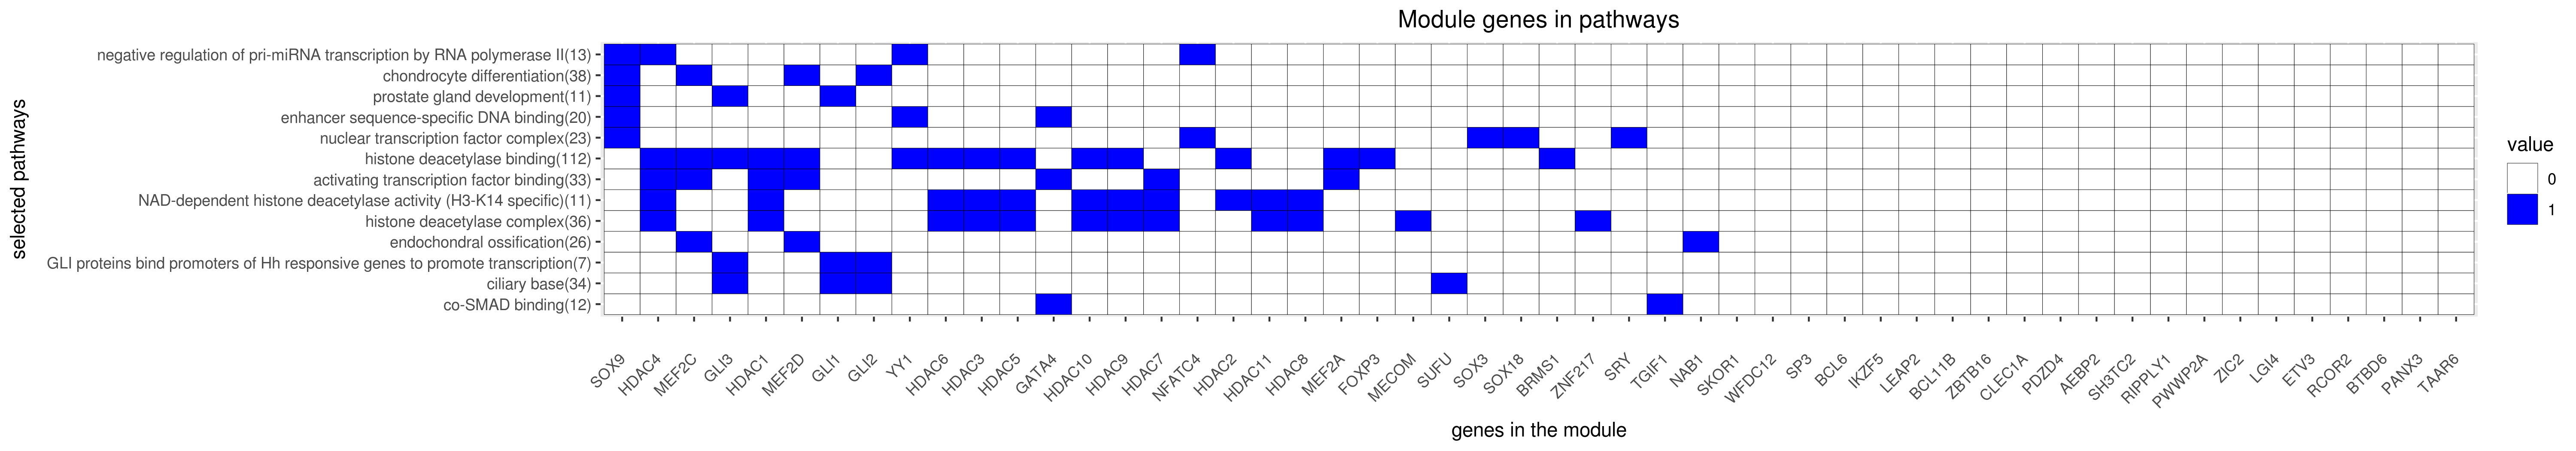
Module genes
This module comprises the following genes:
| Gene ID |
Gene Symbol |
Gene Name |
| 121536
|
AEBP2
|
AE binding protein 2
|
| 64919
|
BCL11B
|
B cell CLL/lymphoma 11B
|
| 604
|
BCL6
|
B cell CLL/lymphoma 6
|
| 84312
|
BRMS1
|
BRMS1 like transcriptional repressor
|
| 90135
|
BTBD6
|
BTB domain containing 6
|
| 388272
|
C16orf87
|
chromosome 16 open reading frame 87
|
| 51267
|
CLEC1A
|
C-type lectin domain family 1 member A
|
| 2117
|
ETV3
|
ETS variant 3
|
| 50943
|
FOXP3
|
forkhead box P3
|
| 83856
|
FSD1L
|
fibronectin type III and SPRY domain containing 1 like
|
| 2626
|
GATA4
|
GATA binding protein 4
|
| 2735
|
GLI1
|
GLI family zinc finger 1
|
| 2736
|
GLI2
|
GLI family zinc finger 2
|
| 2737
|
GLI3
|
GLI family zinc finger 3
|
| 3065
|
HDAC1
|
histone deacetylase 1
|
| 83933
|
HDAC10
|
histone deacetylase 10
|
| 79885
|
HDAC11
|
histone deacetylase 11
|
| 3066
|
HDAC2
|
histone deacetylase 2
|
| 8841
|
HDAC3
|
histone deacetylase 3
|
| 9759
|
HDAC4
|
histone deacetylase 4
|
| 10014
|
HDAC5
|
histone deacetylase 5
|
| 10013
|
HDAC6
|
histone deacetylase 6
|
| 51564
|
HDAC7
|
histone deacetylase 7
|
| 55869
|
HDAC8
|
histone deacetylase 8
|
| 9734
|
HDAC9
|
histone deacetylase 9
|
| 139324
|
HDX
|
highly divergent homeobox
|
| 64376
|
IKZF5
|
IKAROS family zinc finger 5
|
| 116842
|
LEAP2
|
liver enriched antimicrobial peptide 2
|
| 163175
|
LGI4
|
leucine rich repeat LGI family member 4
|
| 96626
|
LIMS3
|
LIM zinc finger domain containing 3
|
| 2122
|
MECOM
|
MDS1 and EVI1 complex locus
|
| 4205
|
MEF2A
|
myocyte enhancer factor 2A
|
| 4208
|
MEF2C
|
myocyte enhancer factor 2C
|
| 4209
|
MEF2D
|
myocyte enhancer factor 2D
|
| 4664
|
NAB1
|
NGFI-A binding protein 1
|
| 4776
|
NFATC4
|
nuclear factor of activated T cells 4
|
| 116337
|
PANX3
|
pannexin 3
|
| 57595
|
PDZD4
|
PDZ domain containing 4
|
| 114825
|
PWWP2A
|
PWWP domain containing 2A
|
| 55472
|
RBM12B-AS1
|
RBM12B antisense RNA 1
|
| 283248
|
RCOR2
|
REST corepressor 2
|
| 92129
|
RIPPLY1
|
ripply transcriptional repressor 1
|
| 79628
|
SH3TC2
|
SH3 domain and tetratricopeptide repeats 2
|
| 390598
|
SKOR1
|
SKI family transcriptional corepressor 1
|
| 56731
|
SLC2A4RG
|
SLC2A4 regulator
|
| 54345
|
SOX18
|
SRY-box 18
|
| 6658
|
SOX3
|
SRY-box 3
|
| 6662
|
SOX9
|
SRY-box 9
|
| 6670
|
SP3
|
Sp3 transcription factor
|
| 6736
|
SRY
|
sex determining region Y
|
| 361769
|
SUFU
|
SUFU negative regulator of hedgehog signaling
|
| 319100
|
TAAR6
|
trace amine associated receptor 6
|
| 7050
|
TGIF1
|
TGFB induced factor homeobox 1
|
| 128488
|
WFDC12
|
WAP four-disulfide core domain 12
|
| 7528
|
YY1
|
YY1 transcription factor
|
| 7704
|
ZBTB16
|
zinc finger and BTB domain containing 16
|
| 92999
|
ZBTB47
|
zinc finger and BTB domain containing 47
|
| 7546
|
ZIC2
|
Zic family member 2
|
| 7764
|
ZNF217
|
zinc finger protein 217
|
|
Functional annotation
Modules were tested for enrichment in functional and pathway annotations using two complementary approaches:
1. To select a small number of specific / non-redundant annotations for each module, a regression-based approach was used;
2. To obtain the complete set of enriched annotations, an extension of Fisher’s exact test that takes annotation bias into account was employed (Wallenius’ non-central hypergeometric distribution).
Most specific annotations for this module
1Regression coefficient
2Fisher’s exact test nominal P-value
3Annotation source (Reactome, GO biological process (BP), molecular function (MF) and cellular component (CC))
4GO category or Reactome pathway
5High-level branch of annotation tree
Gene membership
All enriched annotations
Gene Ontology
11Nominal enrichment p-value (Wallenius’ noncentral hypergeometric distribution)
2FDR corrected p-value (Benjamini-Hochberg)
Reactome
| P-value1 |
FDR2 |
Term |
| 0.00e+00
|
0.00e+00
|
NOTCH1 INTRACELLULAR DOMAIN REGULATES TRANSCRIPTION
|
| 0.00e+00
|
0.00e+00
|
SIGNALING BY NOTCH
|
| 0.00e+00
|
0.00e+00
|
SIGNALING BY NOTCH1
|
| 0.00e+00
|
0.00e+00
|
NOTCH1 INTRACELLULAR DOMAIN REGULATES TRANSCRIPTION
|
| 0.00e+00
|
0.00e+00
|
SIGNALING BY NOTCH
|
| 0.00e+00
|
0.00e+00
|
SIGNALING BY NOTCH1
|
| 7.24e-05
|
9.45e-03
|
MYOGENESIS
|
| 5.08e-04
|
6.52e-02
|
MYOGENESIS
|
| 8.28e-04
|
8.51e-02
|
CIRCADIAN CLOCK
|
| 2.03e-03
|
2.16e-01
|
CIRCADIAN CLOCK
|
| 2.64e-03
|
2.37e-01
|
DOWNREGULATION OF SMAD2 3 SMAD4 TRANSCRIPTIONAL ACTIVITY
|
| 3.30e-03
|
2.88e-01
|
SMAD2 SMAD3 SMAD4 HETEROTRIMER REGULATES TRANSCRIPTION
|
| 3.57e-03
|
3.09e-01
|
FACTORS INVOLVED IN MEGAKARYOCYTE DEVELOPMENT AND PLATELET PRODUCTION
|
| 4.43e-03
|
3.70e-01
|
P75 NTR RECEPTOR MEDIATED SIGNALLING
|
| 4.93e-03
|
4.06e-01
|
SIGNALLING BY NGF
|
| 7.51e-03
|
6.37e-01
|
DOWNREGULATION OF SMAD2 3 SMAD4 TRANSCRIPTIONAL ACTIVITY
|
| 8.41e-03
|
6.37e-01
|
TRANSCRIPTIONAL ACTIVITY OF SMAD2 SMAD3 SMAD4 HETEROTRIMER
|
| 9.49e-03
|
7.03e-01
|
ERK MAPK TARGETS
|
| 9.87e-03
|
7.93e-01
|
SMAD2 SMAD3 SMAD4 HETEROTRIMER REGULATES TRANSCRIPTION
|
| 1.07e-02
|
8.40e-01
|
ERK MAPK TARGETS
|
|
11Nominal enrichment p-value (Wallenius’ noncentral hypergeometric distribution)
2FDR corrected p-value (Benjamini-Hochberg)
Mouse mutant phenotypes
11Nominal enrichment p-value (Wallenius’ noncentral hypergeometric distribution)
2FDR corrected p-value (Benjamini-Hochberg)
Generated on: Thu Aug 30 17:31:42 2018 - R2HTML