Back to main page
DREAM Module Identification Challenge – Consensus modules
PPI-STRING_Consensus_mod221
| Assigned name |
NA |
| Network |
PPI-STRING |
| Module ID |
PPI-STRING_Consensus_mod221 |
| Module size |
21 genes |
|
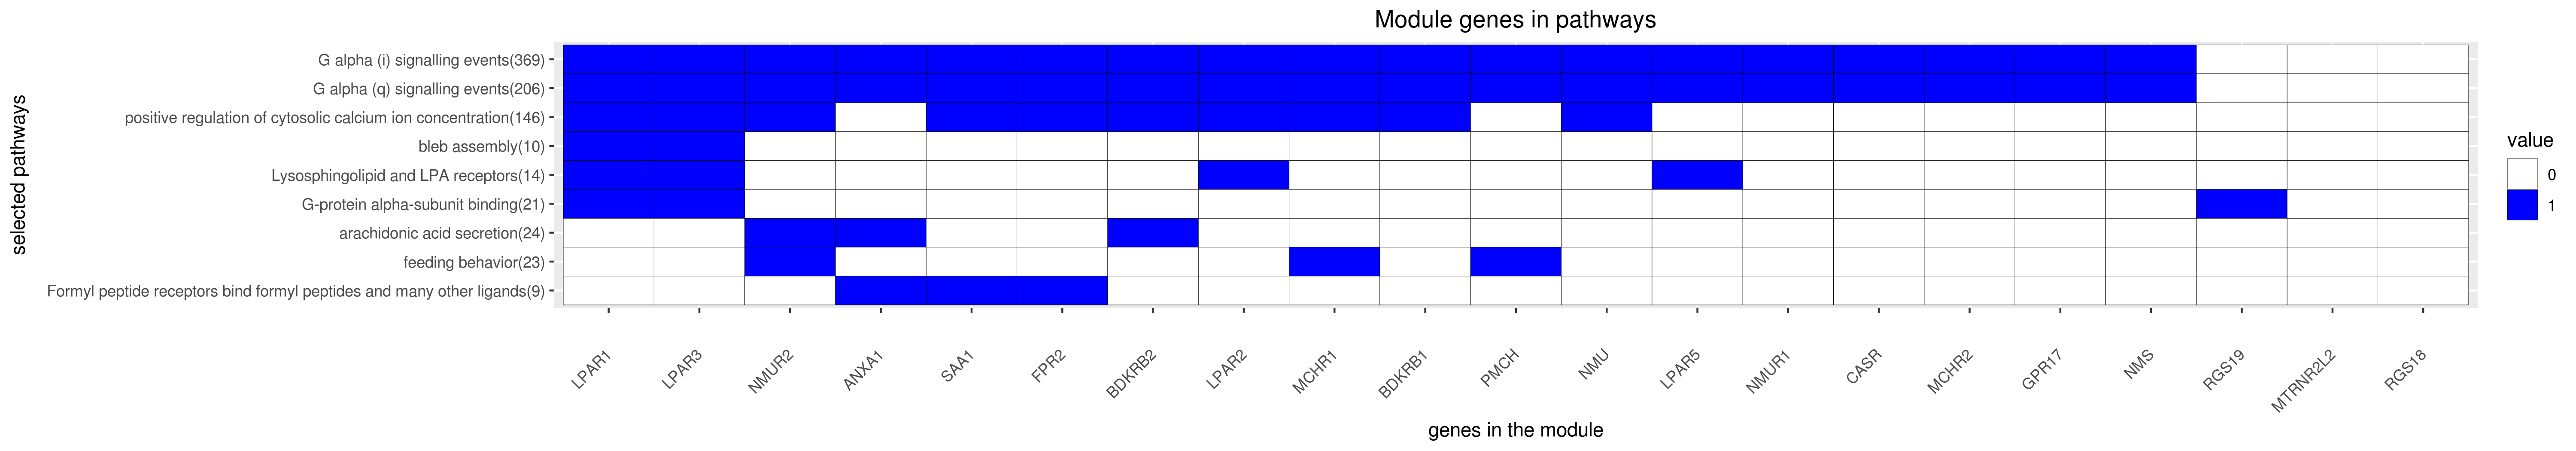
Module genes
This module comprises the following genes:
| Gene ID |
Gene Symbol |
Gene Name |
| 301
|
ANXA1
|
annexin A1
|
| 623
|
BDKRB1
|
bradykinin receptor B1
|
| 623
|
BDKRB2
|
bradykinin receptor B1
|
| 846
|
CASR
|
calcium sensing receptor
|
| 2358
|
FPR2
|
formyl peptide receptor 2
|
| 2840
|
GPR17
|
G protein-coupled receptor 17
|
| 1902
|
LPAR1
|
lysophosphatidic acid receptor 1
|
| 9170
|
LPAR2
|
lysophosphatidic acid receptor 2
|
| 23566
|
LPAR3
|
lysophosphatidic acid receptor 3
|
| 57121
|
LPAR5
|
lysophosphatidic acid receptor 5
|
| 2847
|
MCHR1
|
melanin concentrating hormone receptor 1
|
| 84539
|
MCHR2
|
melanin concentrating hormone receptor 2
|
| 100462981
|
MTRNR2L2
|
MT-RNR2 like 2
|
| 129521
|
NMS
|
neuromedin S
|
| 63887
|
NMU
|
neuromedin U
|
| 10316
|
NMUR1
|
neuromedin U receptor 1
|
| 56923
|
NMUR2
|
neuromedin U receptor 2
|
| 5367
|
PMCH
|
pro-melanin concentrating hormone
|
| 64407
|
RGS18
|
regulator of G protein signaling 18
|
| 10287
|
RGS19
|
regulator of G protein signaling 19
|
| 6288
|
SAA1
|
serum amyloid A1
|
|
Functional annotation
Modules were tested for enrichment in functional and pathway annotations using two complementary approaches:
1. To select a small number of specific / non-redundant annotations for each module, a regression-based approach was used;
2. To obtain the complete set of enriched annotations, an extension of Fisher’s exact test that takes annotation bias into account was employed (Wallenius’ non-central hypergeometric distribution).
Most specific annotations for this module
1Regression coefficient
2Fisher’s exact test nominal P-value
3Annotation source (Reactome, GO biological process (BP), molecular function (MF) and cellular component (CC))
4GO category or Reactome pathway
5High-level branch of annotation tree
Gene membership
All enriched annotations
Gene Ontology
11Nominal enrichment p-value (Wallenius’ noncentral hypergeometric distribution)
2FDR corrected p-value (Benjamini-Hochberg)
Reactome
| P-value1 |
FDR2 |
Term |
| 0.00e+00
|
0e+00
|
GASTRIN CREB SIGNALLING PATHWAY VIA PKC AND MAPK
|
| 0.00e+00
|
0e+00
|
G ALPHA I SIGNALLING EVENTS
|
| 0.00e+00
|
0e+00
|
CLASS A1 RHODOPSIN LIKE RECEPTORS
|
| 0.00e+00
|
0e+00
|
GPCR LIGAND BINDING
|
| 0.00e+00
|
0e+00
|
G ALPHA Q SIGNALLING EVENTS
|
| 0.00e+00
|
0e+00
|
PEPTIDE LIGAND BINDING RECEPTORS
|
| 0.00e+00
|
0e+00
|
GASTRIN CREB SIGNALLING PATHWAY VIA PKC AND MAPK
|
| 0.00e+00
|
0e+00
|
G ALPHA I SIGNALLING EVENTS
|
| 0.00e+00
|
0e+00
|
G ALPHA Q SIGNALLING EVENTS
|
| 0.00e+00
|
0e+00
|
PEPTIDE LIGAND BINDING RECEPTORS
|
| 2.41e-02
|
1e+00
|
CLASS C 3 METABOTROPIC GLUTAMATE PHEROMONE RECEPTORS
|
| 2.46e-02
|
1e+00
|
ADVANCED GLYCOSYLATION ENDPRODUCT RECEPTOR SIGNALING
|
| 2.69e-02
|
1e+00
|
TRAF6 MEDIATED NFKB ACTIVATION
|
| 2.89e-02
|
1e+00
|
RIP MEDIATED NFKB ACTIVATION VIA DAI
|
| 3.16e-02
|
1e+00
|
RIP MEDIATED NFKB ACTIVATION VIA DAI
|
| 3.38e-02
|
1e+00
|
CLASS C 3 METABOTROPIC GLUTAMATE PHEROMONE RECEPTORS
|
| 3.42e-02
|
1e+00
|
ADVANCED GLYCOSYLATION ENDPRODUCT RECEPTOR SIGNALING
|
| 3.89e-02
|
1e+00
|
TAK1 ACTIVATES NFKB BY PHOSPHORYLATION AND ACTIVATION OF IKKS COMPLEX
|
| 4.09e-02
|
1e+00
|
TAK1 ACTIVATES NFKB BY PHOSPHORYLATION AND ACTIVATION OF IKKS COMPLEX
|
|
11Nominal enrichment p-value (Wallenius’ noncentral hypergeometric distribution)
2FDR corrected p-value (Benjamini-Hochberg)
Mouse mutant phenotypes
11Nominal enrichment p-value (Wallenius’ noncentral hypergeometric distribution)
2FDR corrected p-value (Benjamini-Hochberg)
Generated on: Thu Aug 30 17:30:41 2018 - R2HTML