Back to main page
DREAM Module Identification Challenge – Consensus modules
PPI-STRING_Consensus_mod191
| Assigned name |
NA |
| Network |
PPI-STRING |
| Module ID |
PPI-STRING_Consensus_mod191 |
| Module size |
31 genes |
|
Module genes
This module comprises the following genes:
| Gene ID |
Gene Symbol |
Gene Name |
| 189
|
AGT
|
alanine--glyoxylate and serine--pyruvate aminotransferase
|
| 265
|
AMELX
|
amelogenin X-linked
|
| 266
|
AMELY
|
amelogenin Y-linked
|
| 351
|
APP
|
amyloid beta precursor protein
|
| 553
|
AVPR1B
|
arginine vasopressin receptor 1B
|
| 4345
|
CD200
|
CD200 molecule
|
| 131450
|
CD200R1
|
CD200 receptor 1
|
| 344807
|
CD200R1L
|
CD200 receptor 1 like
|
| 1363
|
CPE
|
carboxypeptidase E
|
| 2520
|
GAST
|
gastrin
|
| 2767
|
GNA11
|
G protein subunit alpha 11
|
| 9630
|
GNA14
|
G protein subunit alpha 14
|
| 2776
|
GNAQ
|
G protein subunit alpha q
|
| 54331
|
GNG2
|
G protein subunit gamma 2
|
| 2869
|
GRK5
|
G protein-coupled receptor kinase 5
|
| 3827
|
KNG1
|
kininogen 1
|
| 4142
|
MAS1
|
MAS1 proto-oncogene, G protein-coupled receptor
|
| 4224
|
MEP1A
|
meprin A subunit alpha
|
| 4225
|
MEP1B
|
meprin A subunit beta
|
| 10893
|
MMP24
|
matrix metallopeptidase 24
|
| 64231
|
MS4A6A
|
membrane spanning 4-domains A6A
|
| 221391
|
OPN5
|
opsin 5
|
| 23236
|
PLCB1
|
phospholipase C beta 1
|
| 5330
|
PLCB2
|
phospholipase C beta 2
|
| 5331
|
PLCB3
|
phospholipase C beta 3
|
| 5332
|
PLCB4
|
phospholipase C beta 4
|
| 5550
|
PREP
|
prolyl endopeptidase
|
| 60626
|
RIC8A
|
RIC8 guanine nucleotide exchange factor A
|
| 55188
|
RIC8B
|
RIC8 guanine nucleotide exchange factor B
|
| 26165
|
SPATA31A7
|
SPATA31 subfamily A member 7
|
| 169981
|
SPIN3
|
spindlin family member 3
|
|
Functional annotation
Modules were tested for enrichment in functional and pathway annotations using two complementary approaches:
1. To select a small number of specific / non-redundant annotations for each module, a regression-based approach was used;
2. To obtain the complete set of enriched annotations, an extension of Fisher’s exact test that takes annotation bias into account was employed (Wallenius’ non-central hypergeometric distribution).
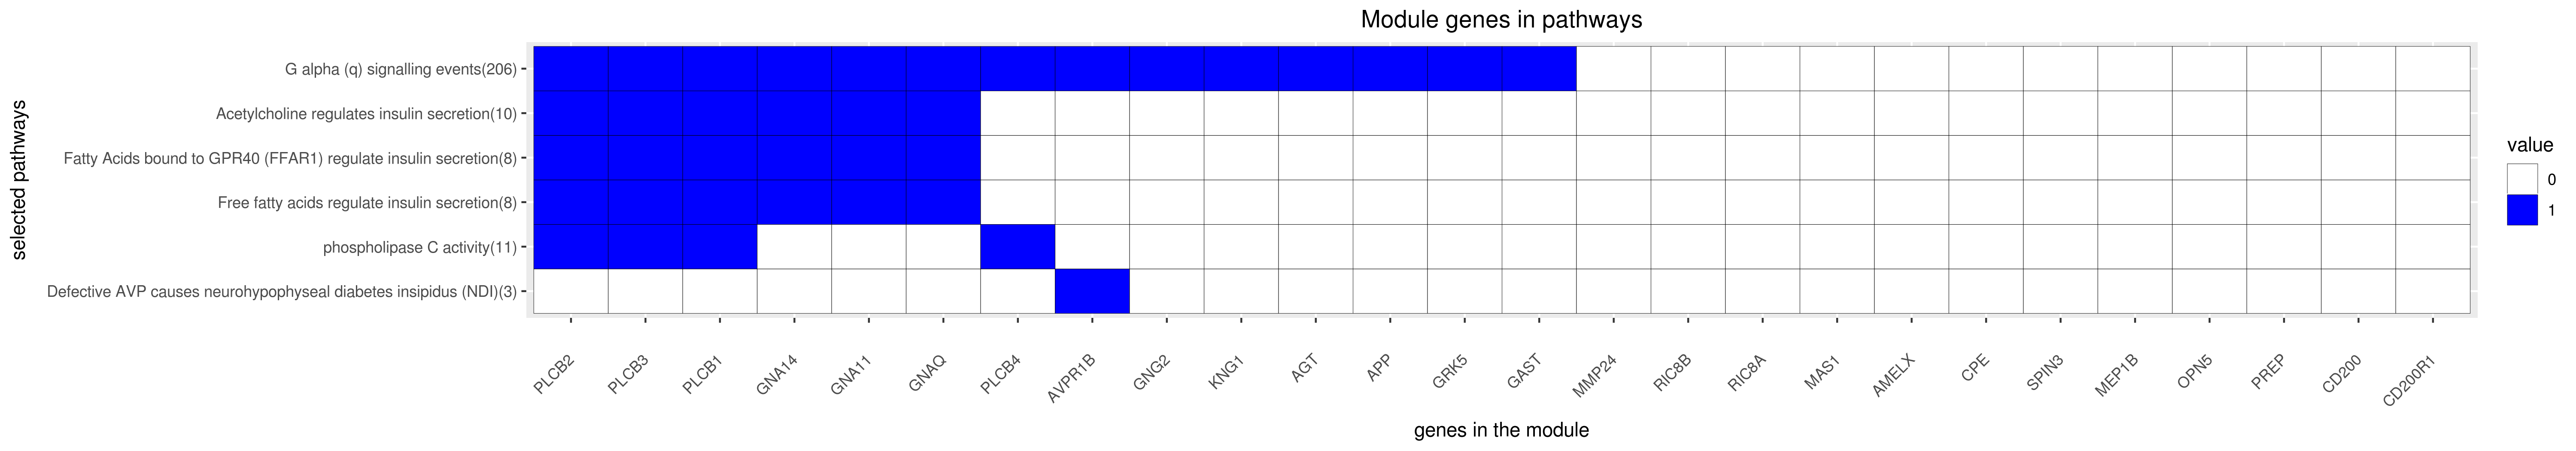
Most specific annotations for this module
1Regression coefficient
2Fisher’s exact test nominal P-value
3Annotation source (Reactome, GO biological process (BP), molecular function (MF) and cellular component (CC))
4GO category or Reactome pathway
5High-level branch of annotation tree
Gene membership
All enriched annotations
Gene Ontology
11Nominal enrichment p-value (Wallenius’ noncentral hypergeometric distribution)
2FDR corrected p-value (Benjamini-Hochberg)
Reactome
| P-value1 |
FDR2 |
Term |
| 0.00e+00
|
0.00e+00
|
GASTRIN CREB SIGNALLING PATHWAY VIA PKC AND MAPK
|
| 0.00e+00
|
0.00e+00
|
G ALPHA Q SIGNALLING EVENTS
|
| 0.00e+00
|
0.00e+00
|
GASTRIN CREB SIGNALLING PATHWAY VIA PKC AND MAPK
|
| 0.00e+00
|
0.00e+00
|
G ALPHA Q SIGNALLING EVENTS
|
| 6.08e-12
|
1.79e-09
|
REGULATION OF INSULIN SECRETION BY ACETYLCHOLINE
|
| 2.03e-10
|
7.19e-08
|
REGULATION OF INSULIN SECRETION BY ACETYLCHOLINE
|
| 8.54e-07
|
1.50e-04
|
REGULATION OF INSULIN SECRETION
|
| 3.63e-06
|
7.43e-04
|
REGULATION OF INSULIN SECRETION
|
| 4.07e-06
|
6.45e-04
|
INTEGRATION OF ENERGY METABOLISM
|
| 1.79e-05
|
3.26e-03
|
INTEGRATION OF ENERGY METABOLISM
|
| 1.88e-05
|
3.41e-03
|
CLASS A1 RHODOPSIN LIKE RECEPTORS
|
| 2.01e-05
|
2.87e-03
|
G BETA GAMMA SIGNALLING THROUGH PLC BETA
|
| 2.63e-05
|
3.68e-03
|
THROMBOXANE SIGNALLING THROUGH TP RECEPTOR
|
| 3.99e-05
|
6.84e-03
|
GPCR LIGAND BINDING
|
| 4.34e-05
|
5.88e-03
|
ADP SIGNALLING THROUGH P2RY1
|
| 4.65e-05
|
7.81e-03
|
PEPTIDE LIGAND BINDING RECEPTORS
|
| 6.03e-05
|
7.98e-03
|
ACTIVATION OF KAINATE RECEPTORS UPON GLUTAMATE BINDING
|
| 6.42e-05
|
8.46e-03
|
THROMBIN SIGNALLING THROUGH PROTEINASE ACTIVATED RECEPTORS PARS
|
| 6.56e-05
|
8.63e-03
|
G PROTEIN BETA GAMMA SIGNALLING
|
| 8.46e-05
|
1.10e-02
|
SIGNAL AMPLIFICATION
|
|
11Nominal enrichment p-value (Wallenius’ noncentral hypergeometric distribution)
2FDR corrected p-value (Benjamini-Hochberg)
Mouse mutant phenotypes
11Nominal enrichment p-value (Wallenius’ noncentral hypergeometric distribution)
2FDR corrected p-value (Benjamini-Hochberg)
Generated on: Thu Aug 30 17:29:14 2018 - R2HTML