Back to main page
DREAM Module Identification Challenge – Consensus modules
PPI-STRING_Consensus_mod182
| Assigned name |
NA |
| Network |
PPI-STRING |
| Module ID |
PPI-STRING_Consensus_mod182 |
| Module size |
24 genes |
|
Module genes
This module comprises the following genes:
| Gene ID |
Gene Symbol |
Gene Name |
| 107
|
ADCY1
|
adenylate cyclase 1
|
| 108
|
ADCY2
|
adenylate cyclase 2
|
| 114
|
ADCY3
|
adenylate cyclase 8
|
| 196883
|
ADCY4
|
adenylate cyclase 4
|
| 111
|
ADCY5
|
adenylate cyclase 5
|
| 112
|
ADCY6
|
adenylate cyclase 6
|
| 113
|
ADCY7
|
adenylate cyclase 7
|
| 114
|
ADCY8
|
adenylate cyclase 8
|
| 2768
|
GNA12
|
G protein subunit alpha 12
|
| 10672
|
GNA13
|
G protein subunit alpha 13
|
| 2770
|
GNAI1
|
G protein subunit alpha i1
|
| 2771
|
GNAI2
|
G protein subunit alpha i2
|
| 2773
|
GNAI3
|
G protein subunit alpha i3
|
| 2775
|
GNAO1
|
G protein subunit alpha o1
|
| 2779
|
GNAT1
|
G protein subunit alpha transducin 1
|
| 2780
|
GNAT2
|
G protein subunit alpha transducin 2
|
| 346562
|
GNAT3
|
G protein subunit alpha transducin 3
|
| 2781
|
GNAZ
|
G protein subunit alpha z
|
| 2783
|
GNB2
|
G protein subunit beta 2
|
| 59345
|
GNB4
|
G protein subunit beta 4
|
| NA
|
GNG5P2
|
|
| 347404
|
LANCL3
|
LanC like 3
|
| 8622
|
PDE8B
|
phosphodiesterase 8B
|
| 388531
|
RGS9BP
|
regulator of G protein signaling 9 binding protein
|
|
Functional annotation
Modules were tested for enrichment in functional and pathway annotations using two complementary approaches:
1. To select a small number of specific / non-redundant annotations for each module, a regression-based approach was used;
2. To obtain the complete set of enriched annotations, an extension of Fisher’s exact test that takes annotation bias into account was employed (Wallenius’ non-central hypergeometric distribution).
Most specific annotations for this module
1Regression coefficient
2Fisher’s exact test nominal P-value
3Annotation source (Reactome, GO biological process (BP), molecular function (MF) and cellular component (CC))
4GO category or Reactome pathway
5High-level branch of annotation tree
Gene membership
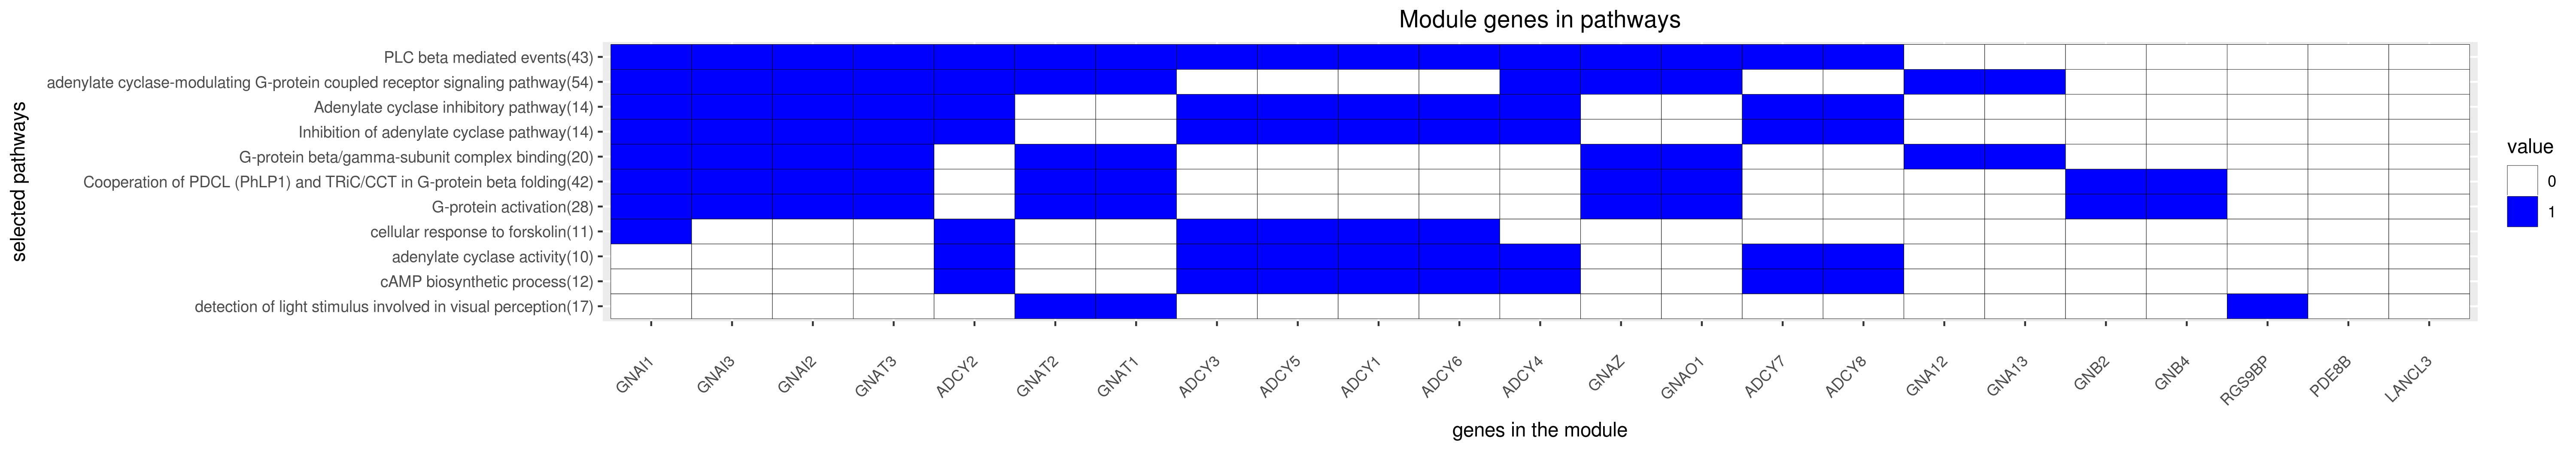
All enriched annotations
Gene Ontology
11Nominal enrichment p-value (Wallenius’ noncentral hypergeometric distribution)
2FDR corrected p-value (Benjamini-Hochberg)
Reactome
| P-value1 |
FDR2 |
Term |
| 0.00e+00
|
0.00e+00
|
G ALPHA I SIGNALLING EVENTS
|
| 0.00e+00
|
0.00e+00
|
OPIOID SIGNALLING
|
| 0.00e+00
|
0.00e+00
|
PLC BETA MEDIATED EVENTS
|
| 0.00e+00
|
0.00e+00
|
ADENYLATE CYCLASE INHIBITORY PATHWAY
|
| 0.00e+00
|
0.00e+00
|
ADENYLATE CYCLASE ACTIVATING PATHWAY
|
| 0.00e+00
|
0.00e+00
|
G ALPHA S SIGNALLING EVENTS
|
| 0.00e+00
|
0.00e+00
|
G ALPHA Z SIGNALLING EVENTS
|
| 0.00e+00
|
0.00e+00
|
GABA B RECEPTOR ACTIVATION
|
| 0.00e+00
|
0.00e+00
|
GABA RECEPTOR ACTIVATION
|
| 0.00e+00
|
0.00e+00
|
INTEGRATION OF ENERGY METABOLISM
|
| 5.96e-11
|
1.67e-08
|
NEUROTRANSMITTER RECEPTOR BINDING AND DOWNSTREAM TRANSMISSION IN THE POSTSYNAPTIC CELL
|
|
11Nominal enrichment p-value (Wallenius’ noncentral hypergeometric distribution)
2FDR corrected p-value (Benjamini-Hochberg)
Mouse mutant phenotypes
11Nominal enrichment p-value (Wallenius’ noncentral hypergeometric distribution)
2FDR corrected p-value (Benjamini-Hochberg)
Generated on: Thu Aug 30 17:28:47 2018 - R2HTML