Back to main page

DREAM Module Identification Challenge – Consensus modules

PPI-STRING_Consensus_mod171

Assigned name NA
Network PPI-STRING
Module ID PPI-STRING_Consensus_mod171
Module size 38 genes

Module genes

This module comprises the following genes:

Gene ID Gene Symbol Gene Name
30

ACAA1 acetyl-CoA acyltransferase 1
10449

ACAA2 acetyl-CoA acyltransferase 2
27034

ACAD8 acyl-CoA dehydrogenase family member 8
28976

ACAD9 acyl-CoA dehydrogenase family member 9
33

ACADL acyl-CoA dehydrogenase long chain
34

ACADM acyl-CoA dehydrogenase medium chain
35

ACADS acyl-CoA dehydrogenase short chain
36

ACADSB acyl-CoA dehydrogenase short/branched chain
37

ACADVL acyl-CoA dehydrogenase very long chain
6646

ACAT1 sterol O-acyltransferase 1
39

ACAT2 acetyl-CoA acetyltransferase 2
8309

ACOX2 acyl-CoA oxidase 2
8310

ACOX3 acyl-CoA oxidase 3, pristanoyl
55289

ACOXL acyl-CoA oxidase like
23600

AMACR alpha-methylacyl-CoA racemase
549

AUH AU RNA binding methylglutaconyl-CoA hydratase
79783

C7orf10 succinyl-CoA:glutarate-CoA transferase
9085

CDY1 chromodomain Y-linked 1
253175

CDY1B chromodomain Y-linked 1B
9426

CDY2A chromodomain Y-linked 2A
203611

CDY2B chromodomain Y-linked 2B
124359

CDYL2 chromodomain Y like 2
51084

CRYL1 crystallin lambda 1
1891

ECH1 enoyl-CoA hydratase 1
55862

ECHDC1 ethylmalonyl-CoA decarboxylase 1
55268

ECHDC2 enoyl-CoA hydratase domain containing 2
79746

ECHDC3 enoyl-CoA hydratase domain containing 3
1892

ECHS1 enoyl-CoA hydratase, short chain 1
1632

ECI1 enoyl-CoA delta isomerase 1
10455

ECI2 enoyl-CoA delta isomerase 2
2639

GCDH glutaryl-CoA dehydrogenase
3033

HADH hydroxyacyl-CoA dehydrogenase
3030

HADHA hydroxyacyl-CoA dehydrogenase trifunctional multienzyme complex subunit alpha
3032

HADHB hydroxyacyl-CoA dehydrogenase trifunctional multienzyme complex subunit beta
26275

HIBCH 3-hydroxyisobutyryl-CoA hydrolase
3028

HSD17B10 hydroxysteroid 17-beta dehydrogenase 10
3712

IVD isovaleryl-CoA dehydrogenase
64064

OXCT2 3-oxoacid CoA-transferase 2

Functional annotation

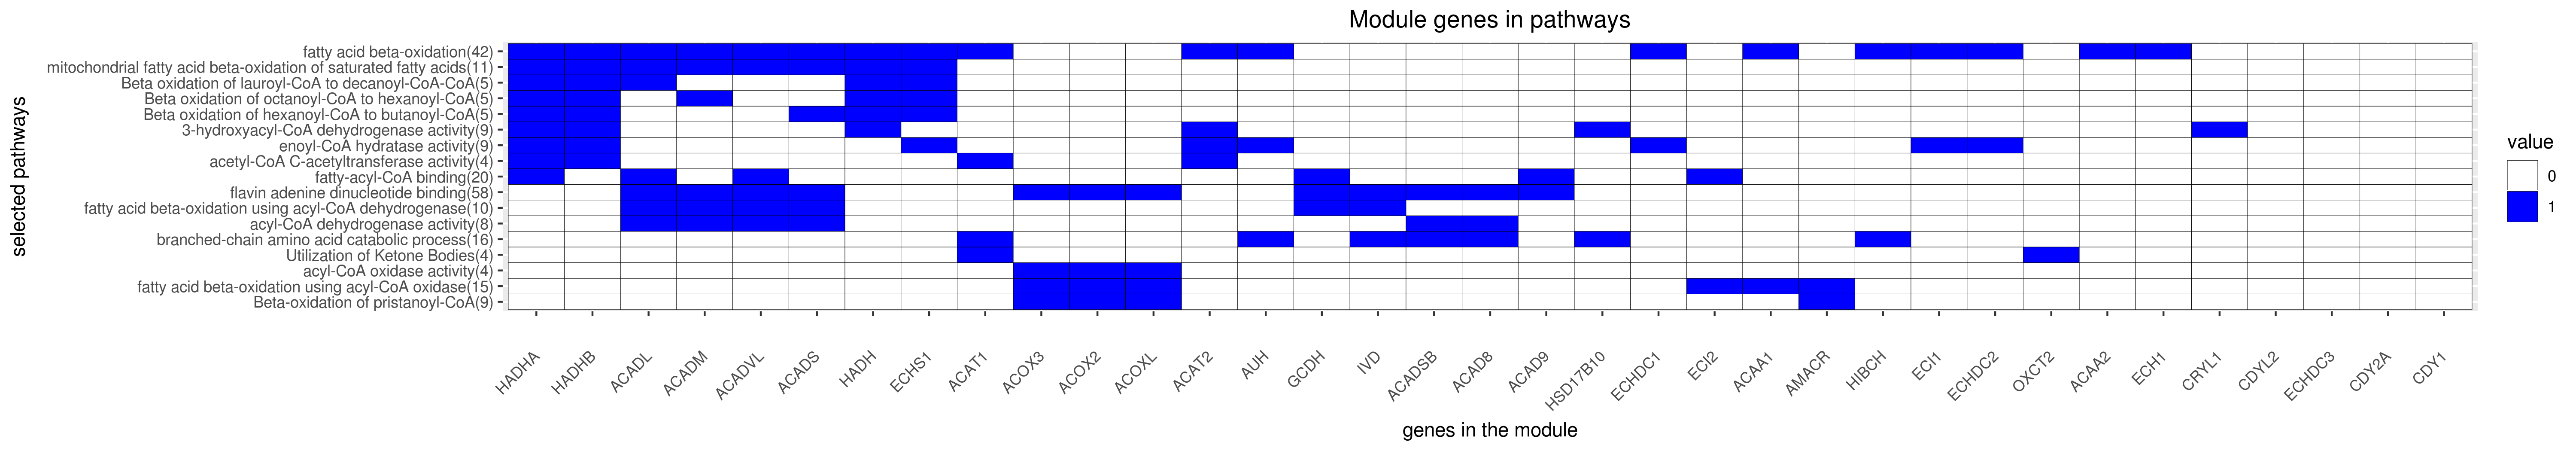
Modules were tested for enrichment in functional and pathway annotations using two complementary approaches:
1. To select a small number of specific / non-redundant annotations for each module, a regression-based approach was used;
2. To obtain the complete set of enriched annotations, an extension of Fisher’s exact test that takes annotation bias into account was employed (Wallenius’ non-central hypergeometric distribution).

Most specific annotations for this module

Coeff.1P-value.2Source.3Term.4Class.5
3.90e-01 1.13e-21 GO enoyl-CoA hydratase activity

molecular_function
3.39e-01 3.10e-08 GO acyl-CoA oxidase activity

molecular_function
2.20e-01 1.27e-15 GO acyl-CoA dehydrogenase activity

molecular_function
1.82e-01 8.69e-16 GO branched-chain amino acid catabolic process

biological_process
1.44e-01 2.41e-05 Reactome Utilization of Ketone Bodies

Metabolism
1.41e-01 9.51e-15 GO fatty acid beta-oxidation using acyl-CoA dehydrogenase

biological_process
1.18e-01 5.99e-40 GO fatty acid beta-oxidation

biological_process
8.89e-02 3.81e-15 GO 3-hydroxyacyl-CoA dehydrogenase activity

molecular_function
8.65e-02 2.06e-20 Reactome mitochondrial fatty acid beta-oxidation of saturated fatty acids

Metabolism
7.50e-02 2.61e-14 Reactome Beta oxidation of hexanoyl-CoA to butanoyl-CoA

Metabolism
7.44e-02 2.61e-14 Reactome Beta oxidation of octanoyl-CoA to hexanoyl-CoA

Metabolism
5.44e-02 1.81e-09 Reactome Beta-oxidation of pristanoyl-CoA

Metabolism
4.58e-02 2.25e-13 GO fatty acid beta-oxidation using acyl-CoA oxidase

biological_process
4.48e-02 1.73e-12 GO fatty-acyl-CoA binding

molecular_function
4.43e-02 2.61e-14 Reactome Beta oxidation of lauroyl-CoA to decanoyl-CoA-CoA

Metabolism
3.35e-02 5.13e-22 GO flavin adenine dinucleotide binding

molecular_function
2.60e-02 1.44e-11 GO acetyl-CoA C-acetyltransferase activity

molecular_function

1Regression coefficient

2Fisher’s exact test nominal P-value

3Annotation source (Reactome, GO biological process (BP), molecular function (MF) and cellular component (CC))

4GO category or Reactome pathway

5High-level branch of annotation tree

Gene membership

All enriched annotations

Gene Ontology

P-value1 FDR2 Term
0e+00 0e+00 fatty acid catabolic process

0e+00 0e+00 lipid oxidation

0e+00 0e+00 fatty acid metabolic process

0e+00 0e+00 carboxylic acid catabolic process

0e+00 0e+00 fatty acid beta-oxidation

0e+00 0e+00 fatty acid oxidation

0e+00 0e+00 lipid catabolic process

0e+00 0e+00 cellular lipid catabolic process

0e+00 0e+00 lipid modification

0e+00 0e+00 monocarboxylic acid metabolic process

0e+00 0e+00 branched-chain amino acid catabolic process

0e+00 0e+00 mitochondrial matrix

0e+00 0e+00 acyl-CoA dehydrogenase activity

0e+00 0e+00 coenzyme binding

0e+00 0e+00 oxidoreductase activity, acting on the CH-CH group of donors

0e+00 0e+00 flavin adenine dinucleotide binding

0e+00 0e+00 cofactor binding

0e+00 0e+00 oxidoreductase activity

0e+00 0e+00 acetyl-CoA C-acyltransferase activity

0e+00 0e+00 enoyl-CoA hydratase activity


11Nominal enrichment p-value (Wallenius’ noncentral hypergeometric distribution)

2FDR corrected p-value (Benjamini-Hochberg)

Reactome

P-value1 FDR2 Term
0.00e+00 0.00e+00 BRANCHED CHAIN AMINO ACID CATABOLISM
0.00e+00 0.00e+00 MITOCHONDRIAL FATTY ACID BETA OXIDATION
4.80e-11 1.35e-08 BRANCHED CHAIN AMINO ACID CATABOLISM
1.10e-10 2.99e-08 FATTY ACID TRIACYLGLYCEROL AND KETONE BODY METABOLISM
1.10e-09 3.62e-07 FATTY ACID TRIACYLGLYCEROL AND KETONE BODY METABOLISM
2.05e-07 5.12e-05 METABOLISM OF AMINO ACIDS AND DERIVATIVES
8.94e-07 1.57e-04 PEROXISOMAL LIPID METABOLISM
2.60e-06 5.45e-04 PEROXISOMAL LIPID METABOLISM
2.62e-06 4.27e-04 METABOLISM OF AMINO ACIDS AND DERIVATIVES
1.12e-03 1.11e-01 SYNTHESIS OF BILE ACIDS AND BILE SALTS VIA 7ALPHA HYDROXYCHOLESTEROL
1.87e-03 1.75e-01 SYNTHESIS OF BILE ACIDS AND BILE SALTS
3.39e-03 3.32e-01 SYNTHESIS OF BILE ACIDS AND BILE SALTS VIA 7ALPHA HYDROXYCHOLESTEROL
5.07e-03 4.63e-01 SYNTHESIS OF BILE ACIDS AND BILE SALTS
5.34e-03 4.34e-01 BILE ACID AND BILE SALT METABOLISM
1.00e-02 7.99e-01 BILE ACID AND BILE SALT METABOLISM
2.51e-02 1.00e+00 SYNTHESIS OF BILE ACIDS AND BILE SALTS VIA 24 HYDROXYCHOLESTEROL
3.93e-02 1.00e+00 GLYCEROPHOSPHOLIPID BIOSYNTHESIS
4.31e-02 1.00e+00 ALPHA LINOLENIC ACID ALA METABOLISM

11Nominal enrichment p-value (Wallenius’ noncentral hypergeometric distribution)

2FDR corrected p-value (Benjamini-Hochberg)

Mouse mutant phenotypes

P-value1 FDR2 Term
5.32e-10 2.18e-05 increased circulating carnitine level

1.75e-09 5.61e-05 hepatic steatosis

2.04e-07 2.53e-03 aciduria

1.01e-06 8.85e-03 decreased circulating carnitine level

5.54e-06 3.17e-02 hypoglycemia

7.68e-06 3.87e-02 abnormal urine homeostasis

9.16e-06 4.43e-02 impaired adaptive thermogenesis

2.62e-05 9.39e-02 increased fatty acid level

2.76e-05 9.76e-02 abnormal lipid homeostasis

2.93e-05 1.01e-01 cardiomyopathy

5.22e-05 1.47e-01 increased unsaturated fatty acid level

1.01e-04 2.28e-01 increased circulating free fatty acid level

1.08e-04 2.39e-01 cardiac fibrosis

2.03e-04 3.52e-01 abnormal adaptive thermogenesis

2.28e-04 3.78e-01 abnormal myocardial fiber morphology

3.42e-04 4.86e-01 myocardial fiber degeneration

6.11e-04 6.81e-01 abnormal brown adipose tissue morphology

1.06e-03 9.29e-01 abnormal fatty acid oxidation

1.16e-03 9.82e-01 abnormal heart morphology

1.40e-03 1.00e+00 abnormal bile composition


11Nominal enrichment p-value (Wallenius’ noncentral hypergeometric distribution)

2FDR corrected p-value (Benjamini-Hochberg)


Generated on: Thu Aug 30 17:28:13 2018 - R2HTML