Back to main page
DREAM Module Identification Challenge – Consensus modules
PPI-STRING_Consensus_mod170
| Assigned name |
NA |
| Network |
PPI-STRING |
| Module ID |
PPI-STRING_Consensus_mod170 |
| Module size |
27 genes |
|
Module genes
This module comprises the following genes:
| Gene ID |
Gene Symbol |
Gene Name |
| 79913
|
ACTR5
|
ARP5 actin related protein 5 homolog
|
| 81611
|
ANP32E
|
acidic nuclear phosphoprotein 32 family member E
|
| 10902
|
BRD8
|
bromodomain containing 8
|
| 124944
|
C17orf49
|
chromosome 17 open reading frame 49
|
| 57680
|
CHD8
|
chromodomain helicase DNA binding protein 8
|
| 84661
|
DPY30
|
dpy-30, histone methyltransferase complex regulatory subunit
|
| 1876
|
E2F6
|
E2F transcription factor 6
|
| 3054
|
HCFC1
|
host cell factor C1
|
| 54985
|
HCFC1R1
|
host cell factor C1 regulator 1
|
| 83444
|
INO80B
|
INO80 complex subunit B
|
| 125476
|
INO80C
|
INO80 complex subunit C
|
| 54891
|
INO80D
|
INO80 complex subunit D
|
| 283899
|
INO80E
|
INO80 complex subunit E
|
| 284058
|
KANSL1
|
KAT8 regulatory NSL complex subunit 1
|
| 54934
|
KANSL2
|
KAT8 regulatory NSL complex subunit 2
|
| 55683
|
KANSL3
|
KAT8 regulatory NSL complex subunit 3
|
| 653657
|
MBD3L3
|
methyl-CpG binding domain protein 3 like 3
|
| 10445
|
MCRS1
|
microspherule protein 1
|
| 23269
|
MGA
|
MGA, MAX dimerization protein
|
| 4297
|
MLL
|
lysine methyltransferase 2A
|
| 4798
|
NFRKB
|
nuclear factor related to kappaB binding protein
|
| 27043
|
PELP1
|
proline, glutamate and leucine rich protein 1
|
| 51230
|
PHF20
|
PHD finger protein 20
|
| 5929
|
RBBP5
|
RB binding protein 5, histone lysine methyltransferase complex subunit
|
| 26168
|
SENP3
|
SUMO specific peptidase 3
|
| 90326
|
THAP3
|
THAP domain containing 3
|
| 11091
|
WDR5
|
WD repeat domain 5
|
|
Functional annotation
Modules were tested for enrichment in functional and pathway annotations using two complementary approaches:
1. To select a small number of specific / non-redundant annotations for each module, a regression-based approach was used;
2. To obtain the complete set of enriched annotations, an extension of Fisher’s exact test that takes annotation bias into account was employed (Wallenius’ non-central hypergeometric distribution).
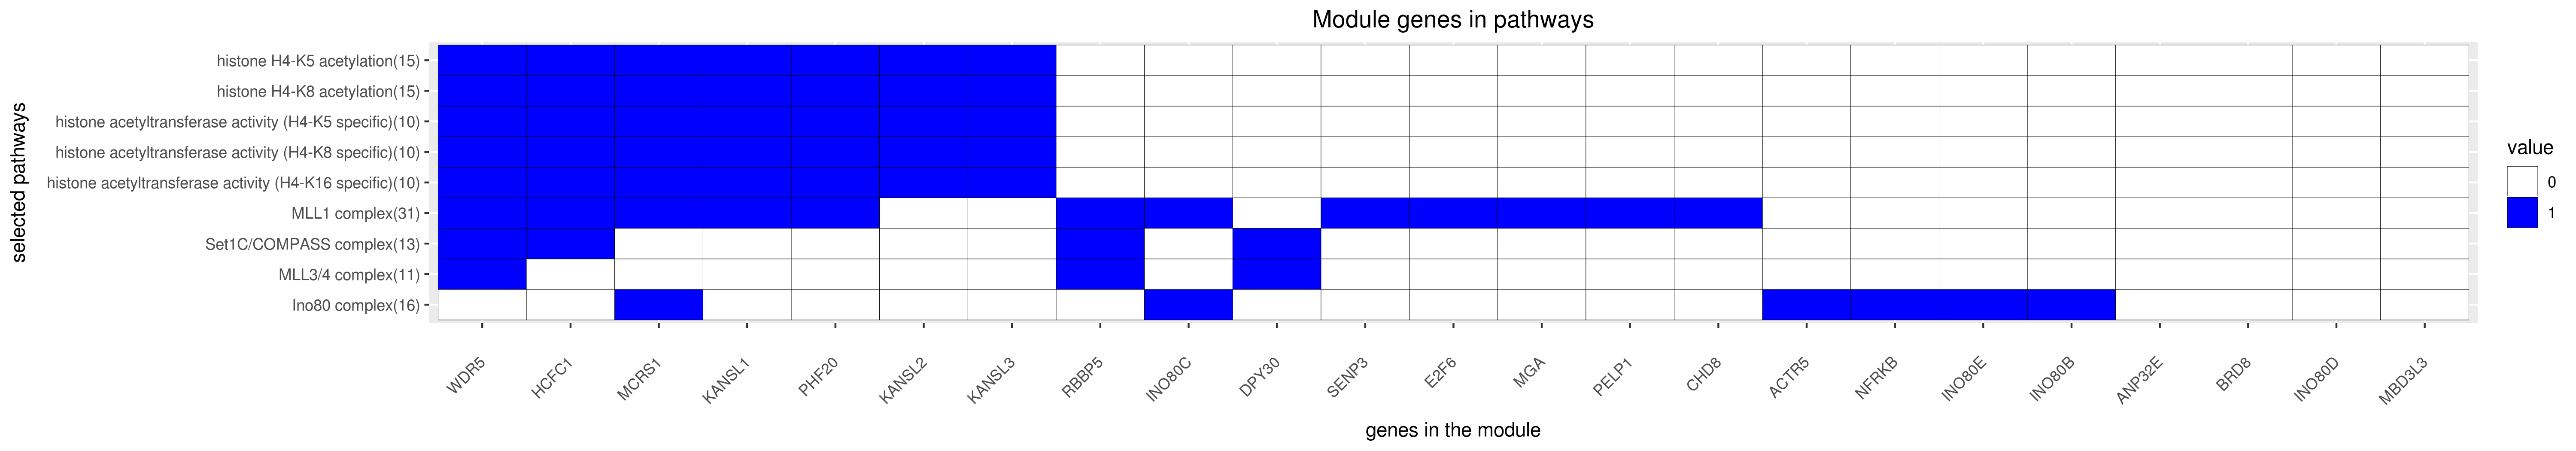
Most specific annotations for this module
1Regression coefficient
2Fisher’s exact test nominal P-value
3Annotation source (Reactome, GO biological process (BP), molecular function (MF) and cellular component (CC))
4GO category or Reactome pathway
5High-level branch of annotation tree
Gene membership
All enriched annotations
Gene Ontology
11Nominal enrichment p-value (Wallenius’ noncentral hypergeometric distribution)
2FDR corrected p-value (Benjamini-Hochberg)
Mouse mutant phenotypes
11Nominal enrichment p-value (Wallenius’ noncentral hypergeometric distribution)
2FDR corrected p-value (Benjamini-Hochberg)
Generated on: Thu Aug 30 17:28:10 2018 - R2HTML