Back to main page
DREAM Module Identification Challenge – Consensus modules
PPI-STRING_Consensus_mod161
| Assigned name |
NA |
| Network |
PPI-STRING |
| Module ID |
PPI-STRING_Consensus_mod161 |
| Module size |
26 genes |
|
Module genes
This module comprises the following genes:
| Gene ID |
Gene Symbol |
Gene Name |
| 919
|
CD247
|
CD247 molecule
|
| 29126
|
CD274
|
CD274 molecule
|
| 940
|
CD28
|
CD28 molecule
|
| 915
|
CD3D
|
CD3d molecule
|
| 916
|
CD3E
|
CD3e molecule
|
| 917
|
CD3G
|
CD3g molecule
|
| 920
|
CD4
|
CD4 molecule
|
| 921
|
CD5
|
CD5 molecule
|
| 941
|
CD80
|
CD80 molecule
|
| 942
|
CD86
|
CD86 molecule
|
| 925
|
CD8A
|
CD8a molecule
|
| 926
|
CD8B
|
CD8b molecule
|
| 1493
|
CTLA4
|
cytotoxic T-lymphocyte associated protein 4
|
| 8320
|
EOMES
|
eomesodermin
|
| 2533
|
FYB
|
FYN binding protein 1
|
| 9402
|
GRAP2
|
GRB2 related adaptor protein 2
|
| 3804
|
KIR2DL3
|
killer cell immunoglobulin like receptor, two Ig domains and long cytoplasmic tail 3
|
| 83985
|
LAT
|
sphingolipid transporter 1 (putative)
|
| 3937
|
LCP2
|
lymphocyte cytosolic protein 2
|
| 55824
|
PAG1
|
phosphoprotein membrane anchor with glycosphingolipid microdomains 1
|
| 5133
|
PDCD1
|
programmed cell death 1
|
| 80380
|
PDCD1LG2
|
programmed cell death 1 ligand 2
|
| 5551
|
PRF1
|
perforin 1
|
| 6452
|
SH3BP2
|
SH3 domain binding protein 2
|
| 84174
|
SLA2
|
Src like adaptor 2
|
| 50852
|
TRAT1
|
T cell receptor associated transmembrane adaptor 1
|
|
Functional annotation
Modules were tested for enrichment in functional and pathway annotations using two complementary approaches:
1. To select a small number of specific / non-redundant annotations for each module, a regression-based approach was used;
2. To obtain the complete set of enriched annotations, an extension of Fisher’s exact test that takes annotation bias into account was employed (Wallenius’ non-central hypergeometric distribution).
Most specific annotations for this module
1Regression coefficient
2Fisher’s exact test nominal P-value
3Annotation source (Reactome, GO biological process (BP), molecular function (MF) and cellular component (CC))
4GO category or Reactome pathway
5High-level branch of annotation tree
Gene membership
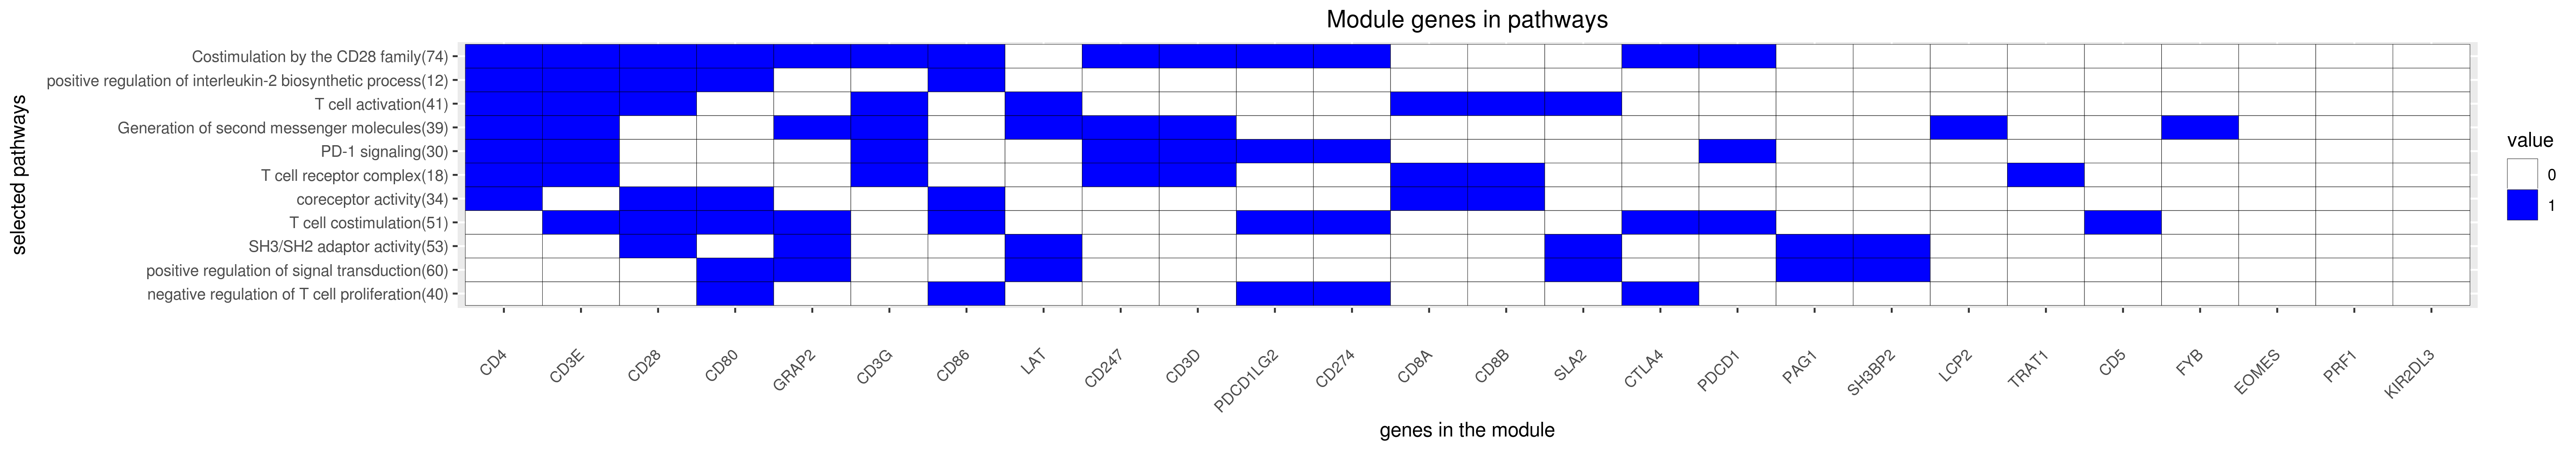
All enriched annotations
Gene Ontology
11Nominal enrichment p-value (Wallenius’ noncentral hypergeometric distribution)
2FDR corrected p-value (Benjamini-Hochberg)
Reactome
| P-value1 |
FDR2 |
Term |
| 0.00e+00
|
0.00e+00
|
GENERATION OF SECOND MESSENGER MOLECULES
|
| 0.00e+00
|
0.00e+00
|
TCR SIGNALING
|
| 0.00e+00
|
0.00e+00
|
PD1 SIGNALING
|
| 0.00e+00
|
0.00e+00
|
COSTIMULATION BY THE CD28 FAMILY
|
| 0.00e+00
|
0.00e+00
|
GENERATION OF SECOND MESSENGER MOLECULES
|
| 0.00e+00
|
0.00e+00
|
TCR SIGNALING
|
| 0.00e+00
|
0.00e+00
|
PD1 SIGNALING
|
| 0.00e+00
|
0.00e+00
|
COSTIMULATION BY THE CD28 FAMILY
|
| 3.29e-11
|
9.41e-09
|
PHOSPHORYLATION OF CD3 AND TCR ZETA CHAINS
|
| 9.53e-10
|
2.33e-07
|
TRANSLOCATION OF ZAP 70 TO IMMUNOLOGICAL SYNAPSE
|
| 2.42e-09
|
5.64e-07
|
IMMUNOREGULATORY INTERACTIONS BETWEEN A LYMPHOID AND A NON LYMPHOID CELL
|
| 3.52e-09
|
8.08e-07
|
DOWNSTREAM TCR SIGNALING
|
| 5.44e-09
|
1.63e-06
|
PHOSPHORYLATION OF CD3 AND TCR ZETA CHAINS
|
| 1.37e-08
|
3.94e-06
|
IMMUNOREGULATORY INTERACTIONS BETWEEN A LYMPHOID AND A NON LYMPHOID CELL
|
| 1.84e-07
|
4.62e-05
|
TRANSLOCATION OF ZAP 70 TO IMMUNOLOGICAL SYNAPSE
|
| 1.05e-06
|
2.37e-04
|
DOWNSTREAM TCR SIGNALING
|
| 5.98e-06
|
9.28e-04
|
CD28 CO STIMULATION
|
| 7.85e-06
|
1.20e-03
|
THE ROLE OF NEF IN HIV1 REPLICATION AND DISEASE PATHOGENESIS
|
| 1.35e-05
|
1.97e-03
|
CD28 DEPENDENT VAV1 PATHWAY
|
| 7.65e-05
|
9.96e-03
|
CD28 DEPENDENT PI3K AKT SIGNALING
|
|
11Nominal enrichment p-value (Wallenius’ noncentral hypergeometric distribution)
2FDR corrected p-value (Benjamini-Hochberg)
Mouse mutant phenotypes
11Nominal enrichment p-value (Wallenius’ noncentral hypergeometric distribution)
2FDR corrected p-value (Benjamini-Hochberg)
Generated on: Thu Aug 30 17:27:43 2018 - R2HTML