Back to main page
DREAM Module Identification Challenge – Consensus modules
PPI-STRING_Consensus_mod141
| Assigned name |
NA |
| Network |
PPI-STRING |
| Module ID |
PPI-STRING_Consensus_mod141 |
| Module size |
42 genes |
|
Module genes
This module comprises the following genes:
| Gene ID |
Gene Symbol |
Gene Name |
| 256076
|
COL6A5
|
collagen type VI alpha 5 chain
|
| 131873
|
COL6A6
|
collagen type VI alpha 6 chain
|
| 25304
|
COMP
|
cartilage oligomeric matrix protein
|
| 80864
|
EGFL8
|
EGF like domain multiple 8
|
| 8515
|
ITGA10
|
integrin subunit alpha 10
|
| 22801
|
ITGA11
|
integrin subunit alpha 11
|
| 3673
|
ITGA2
|
integrin subunit alpha 2
|
| 3674
|
ITGA2B
|
integrin subunit alpha 2b
|
| 3675
|
ITGA3
|
integrin subunit alpha 3
|
| 3676
|
ITGA4
|
integrin subunit alpha 4
|
| 3678
|
ITGA5
|
integrin subunit alpha 5
|
| 3655
|
ITGA6
|
integrin subunit alpha 6
|
| 3679
|
ITGA7
|
integrin subunit alpha 7
|
| 8516
|
ITGA8
|
integrin subunit alpha 8
|
| 3680
|
ITGA9
|
integrin subunit alpha 9
|
| 3681
|
ITGAD
|
integrin subunit alpha D
|
| 3682
|
ITGAE
|
integrin subunit alpha E
|
| 3683
|
ITGAL
|
integrin subunit alpha L
|
| 3685
|
ITGAV
|
integrin subunit alpha V
|
| 3687
|
ITGAX
|
integrin subunit alpha X
|
| 3691
|
ITGB4
|
integrin subunit beta 4
|
| 3693
|
ITGB5
|
integrin subunit beta 5
|
| 3694
|
ITGB6
|
integrin subunit beta 6
|
| 3695
|
ITGB7
|
integrin subunit beta 7
|
| 3696
|
ITGB8
|
integrin subunit beta 8
|
| 9358
|
ITGBL1
|
integrin subunit beta like 1
|
| 22798
|
LAMB4
|
laminin subunit beta 4
|
| 59274
|
MESDC1
|
talin rod domain containing 1
|
| 255743
|
NPNT
|
nephronectin
|
| 5649
|
RELN
|
reelin
|
| 55298
|
RNF121
|
ring finger protein 121
|
| 285533
|
RNF175
|
ring finger protein 175
|
| 6696
|
SPP1
|
secreted phosphoprotein 1
|
| 7057
|
THBS1
|
thrombospondin 1
|
| 7058
|
THBS2
|
thrombospondin 2
|
| 7059
|
THBS3
|
thrombospondin 3
|
| 7060
|
THBS4
|
thrombospondin 4
|
| 83660
|
TLN2
|
talin 2
|
| 3371
|
TNC
|
tenascin C
|
| 63923
|
TNN
|
tenascin N
|
| 7143
|
TNR
|
tenascin R
|
| 10077
|
TSPAN32
|
tetraspanin 32
|
|
Functional annotation
Modules were tested for enrichment in functional and pathway annotations using two complementary approaches:
1. To select a small number of specific / non-redundant annotations for each module, a regression-based approach was used;
2. To obtain the complete set of enriched annotations, an extension of Fisher’s exact test that takes annotation bias into account was employed (Wallenius’ non-central hypergeometric distribution).
Most specific annotations for this module
1Regression coefficient
2Fisher’s exact test nominal P-value
3Annotation source (Reactome, GO biological process (BP), molecular function (MF) and cellular component (CC))
4GO category or Reactome pathway
5High-level branch of annotation tree
Gene membership
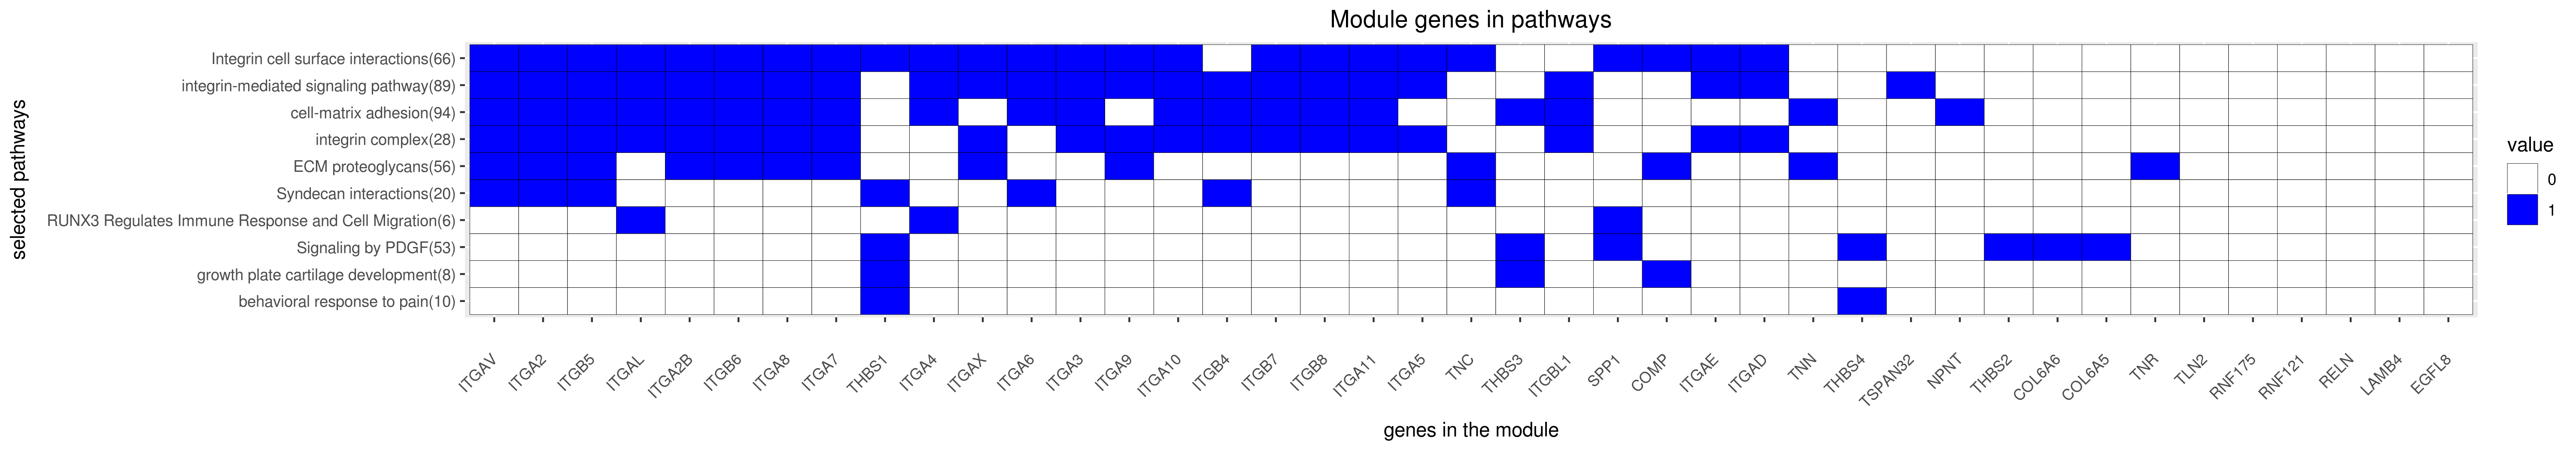
All enriched annotations
Gene Ontology
11Nominal enrichment p-value (Wallenius’ noncentral hypergeometric distribution)
2FDR corrected p-value (Benjamini-Hochberg)
Reactome
| P-value1 |
FDR2 |
Term |
| 0.00e+00
|
0.00e+00
|
INTEGRIN CELL SURFACE INTERACTIONS
|
| 0.00e+00
|
0.00e+00
|
INTEGRIN CELL SURFACE INTERACTIONS
|
| 8.61e-08
|
1.69e-05
|
SIGNAL TRANSDUCTION BY L1
|
| 1.01e-06
|
1.75e-04
|
L1CAM INTERACTIONS
|
| 1.06e-06
|
1.83e-04
|
SIGNALING BY PDGF
|
| 7.88e-06
|
1.20e-03
|
CELL SURFACE INTERACTIONS AT THE VASCULAR WALL
|
| 3.55e-04
|
4.76e-02
|
CELL SURFACE INTERACTIONS AT THE VASCULAR WALL
|
| 3.65e-04
|
4.09e-02
|
AXON GUIDANCE
|
| 5.39e-04
|
6.88e-02
|
SIGNAL TRANSDUCTION BY L1
|
| 7.68e-04
|
9.33e-02
|
L1CAM INTERACTIONS
|
| 3.42e-03
|
2.97e-01
|
ANTIGEN PROCESSING CROSS PRESENTATION
|
| 3.62e-03
|
3.12e-01
|
PECAM1 INTERACTIONS
|
| 7.48e-03
|
6.35e-01
|
SIGNALING BY PDGF
|
| 2.22e-02
|
1.00e+00
|
RESPONSE TO ELEVATED PLATELET CYTOSOLIC CA2
|
| 2.75e-02
|
1.00e+00
|
PLATELET ADHESION TO EXPOSED COLLAGEN
|
| 2.86e-02
|
1.00e+00
|
GRB2 SOS PROVIDES LINKAGE TO MAPK SIGNALING FOR INTERGRINS
|
| 3.22e-02
|
1.00e+00
|
P130CAS LINKAGE TO MAPK SIGNALING FOR INTEGRINS
|
| 4.97e-02
|
1.00e+00
|
INTEGRIN ALPHAIIB BETA3 SIGNALING
|
|
11Nominal enrichment p-value (Wallenius’ noncentral hypergeometric distribution)
2FDR corrected p-value (Benjamini-Hochberg)
Mouse mutant phenotypes
11Nominal enrichment p-value (Wallenius’ noncentral hypergeometric distribution)
2FDR corrected p-value (Benjamini-Hochberg)
Generated on: Thu Aug 30 17:26:42 2018 - R2HTML