Back to main page
DREAM Module Identification Challenge – Consensus modules
PPI-STRING_Consensus_mod138
| Assigned name |
NA |
| Network |
PPI-STRING |
| Module ID |
PPI-STRING_Consensus_mod138 |
| Module size |
22 genes |
|
Module genes
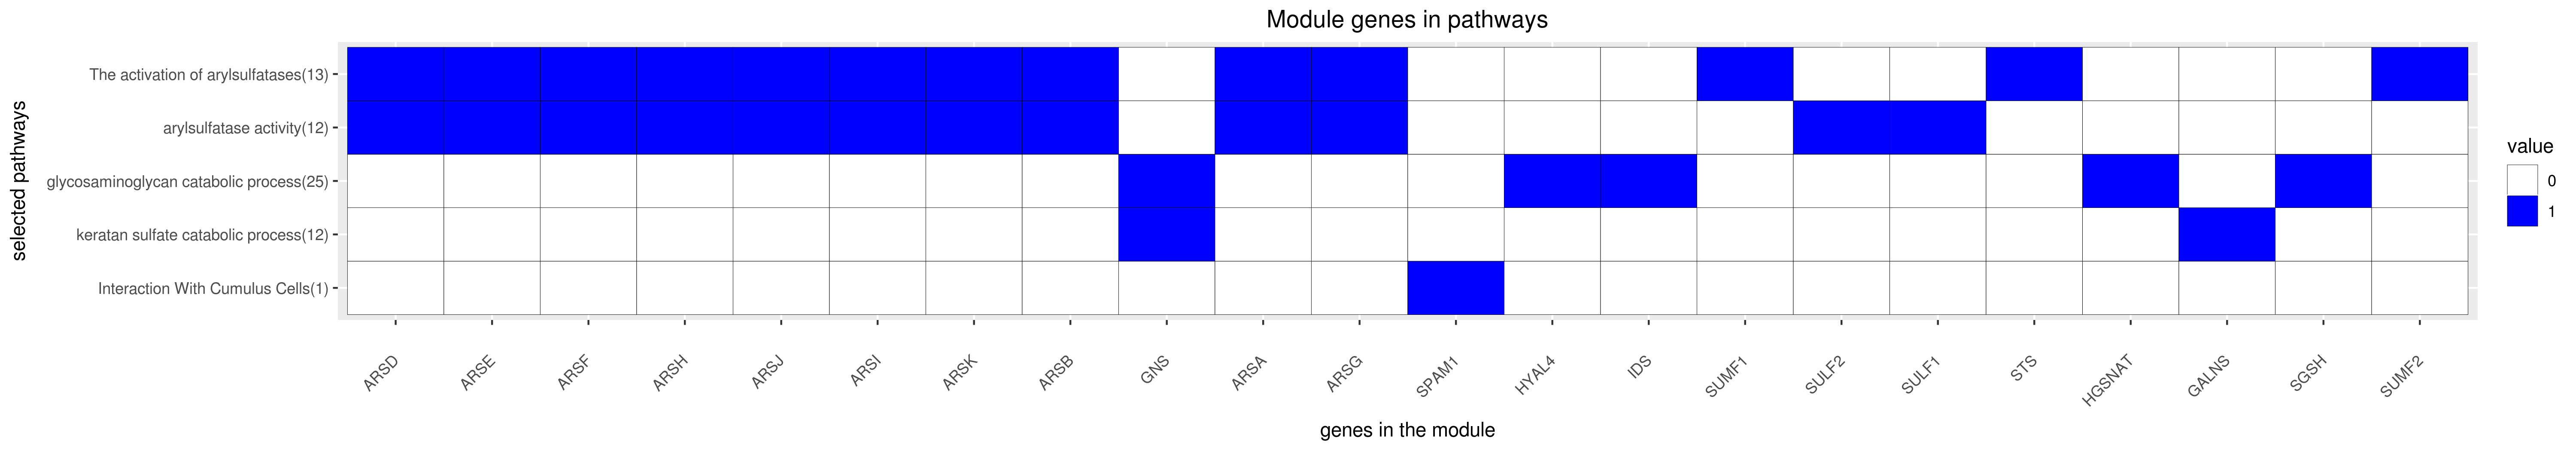
This module comprises the following genes:
| Gene ID |
Gene Symbol |
Gene Name |
| 410
|
ARSA
|
arylsulfatase A
|
| 411
|
ARSB
|
arylsulfatase B
|
| 414
|
ARSD
|
arylsulfatase D
|
| 415
|
ARSE
|
arylsulfatase E
|
| 416
|
ARSF
|
arylsulfatase F
|
| 22901
|
ARSG
|
arylsulfatase G
|
| 347527
|
ARSH
|
arylsulfatase family member H
|
| 340075
|
ARSI
|
arylsulfatase family member I
|
| 79642
|
ARSJ
|
arylsulfatase family member J
|
| 153642
|
ARSK
|
arylsulfatase family member K
|
| 2588
|
GALNS
|
galactosamine (N-acetyl)-6-sulfatase
|
| 2799
|
GNS
|
glucosamine (N-acetyl)-6-sulfatase
|
| 138050
|
HGSNAT
|
heparan-alpha-glucosaminide N-acetyltransferase
|
| 23553
|
HYAL4
|
hyaluronidase 4
|
| 3423
|
IDS
|
iduronate 2-sulfatase
|
| 6448
|
SGSH
|
N-sulfoglucosamine sulfohydrolase
|
| 6677
|
SPAM1
|
sperm adhesion molecule 1
|
| 412
|
STS
|
steroid sulfatase
|
| 23213
|
SULF1
|
sulfatase 1
|
| 55959
|
SULF2
|
sulfatase 2
|
| 285362
|
SUMF1
|
sulfatase modifying factor 1
|
| 25870
|
SUMF2
|
sulfatase modifying factor 2
|
|
Functional annotation
Modules were tested for enrichment in functional and pathway annotations using two complementary approaches:
1. To select a small number of specific / non-redundant annotations for each module, a regression-based approach was used;
2. To obtain the complete set of enriched annotations, an extension of Fisher’s exact test that takes annotation bias into account was employed (Wallenius’ non-central hypergeometric distribution).
Most specific annotations for this module
1Regression coefficient
2Fisher’s exact test nominal P-value
3Annotation source (Reactome, GO biological process (BP), molecular function (MF) and cellular component (CC))
4GO category or Reactome pathway
5High-level branch of annotation tree
Gene membership
All enriched annotations
Gene Ontology
11Nominal enrichment p-value (Wallenius’ noncentral hypergeometric distribution)
2FDR corrected p-value (Benjamini-Hochberg)
Reactome
| P-value1 |
FDR2 |
Term |
| 0.00e+00
|
0.00e+00
|
GLYCOSPHINGOLIPID METABOLISM
|
| 0.00e+00
|
0.00e+00
|
THE ACTIVATION OF ARYLSULFATASES
|
| 0.00e+00
|
0.00e+00
|
PTM GAMMA CARBOXYLATION HYPUSINE FORMATION AND ARYLSULFATASE ACTIVATION
|
| 0.00e+00
|
0.00e+00
|
POST TRANSLATIONAL PROTEIN MODIFICATION
|
| 0.00e+00
|
0.00e+00
|
PHOSPHOLIPID METABOLISM
|
| 0.00e+00
|
0.00e+00
|
SPHINGOLIPID METABOLISM
|
| 0.00e+00
|
0.00e+00
|
GLYCOSPHINGOLIPID METABOLISM
|
| 0.00e+00
|
0.00e+00
|
THE ACTIVATION OF ARYLSULFATASES
|
| 0.00e+00
|
0.00e+00
|
PTM GAMMA CARBOXYLATION HYPUSINE FORMATION AND ARYLSULFATASE ACTIVATION
|
| 0.00e+00
|
0.00e+00
|
POST TRANSLATIONAL PROTEIN MODIFICATION
|
| 0.00e+00
|
0.00e+00
|
SPHINGOLIPID METABOLISM
|
| 0.00e+00
|
0.00e+00
|
PHOSPHOLIPID METABOLISM
|
| 3.23e-04
|
4.38e-02
|
CS DS DEGRADATION
|
| 8.23e-04
|
9.93e-02
|
GLYCOSAMINOGLYCAN METABOLISM
|
| 1.73e-03
|
1.64e-01
|
CS DS DEGRADATION
|
| 2.63e-03
|
2.37e-01
|
GLYCOSAMINOGLYCAN METABOLISM
|
| 4.52e-03
|
4.20e-01
|
METABOLISM OF CARBOHYDRATES
|
| 4.96e-03
|
4.54e-01
|
HS GAG DEGRADATION
|
| 5.47e-03
|
4.41e-01
|
HS GAG DEGRADATION
|
| 9.10e-03
|
7.43e-01
|
CHONDROITIN SULFATE DERMATAN SULFATE METABOLISM
|
|
11Nominal enrichment p-value (Wallenius’ noncentral hypergeometric distribution)
2FDR corrected p-value (Benjamini-Hochberg)
Mouse mutant phenotypes
11Nominal enrichment p-value (Wallenius’ noncentral hypergeometric distribution)
2FDR corrected p-value (Benjamini-Hochberg)
Generated on: Thu Aug 30 17:26:33 2018 - R2HTML