Back to main page
DREAM Module Identification Challenge – Consensus modules
PPI-STRING_Consensus_mod136
| Assigned name |
NA |
| Network |
PPI-STRING |
| Module ID |
PPI-STRING_Consensus_mod136 |
| Module size |
20 genes |
|
Module genes
This module comprises the following genes:
| Gene ID |
Gene Symbol |
Gene Name |
| 55726
|
ASUN
|
integrator complex subunit 13
|
| 79034
|
C7orf26
|
chromosome 7 open reading frame 26
|
| 58493
|
INIP
|
INTS3 and NABP interacting protein
|
| 26173
|
INTS1
|
integrator complex subunit 1
|
| 55174
|
INTS10
|
integrator complex subunit 10
|
| 57508
|
INTS2
|
integrator complex subunit 2
|
| 65123
|
INTS3
|
integrator complex subunit 3
|
| 92105
|
INTS4
|
integrator complex subunit 4
|
| 80789
|
INTS5
|
integrator complex subunit 5
|
| 26512
|
INTS6
|
integrator complex subunit 6
|
| 25896
|
INTS7
|
integrator complex subunit 7
|
| 55656
|
INTS8
|
integrator complex subunit 8
|
| 55756
|
INTS9
|
integrator complex subunit 9
|
| 64859
|
NABP1
|
nucleic acid binding protein 1
|
| 79035
|
NABP2
|
nucleic acid binding protein 2
|
| 203245
|
NAIF1
|
nuclear apoptosis inducing factor 1
|
| 8403
|
SOX14
|
SRY-box 14
|
| 83877
|
TM2D2
|
TM2 domain containing 2
|
| 81556
|
VWA9
|
integrator complex subunit 14
|
| 23613
|
ZMYND8
|
zinc finger MYND-type containing 8
|
|
Functional annotation
Modules were tested for enrichment in functional and pathway annotations using two complementary approaches:
1. To select a small number of specific / non-redundant annotations for each module, a regression-based approach was used;
2. To obtain the complete set of enriched annotations, an extension of Fisher’s exact test that takes annotation bias into account was employed (Wallenius’ non-central hypergeometric distribution).
Most specific annotations for this module
1Regression coefficient
2Fisher’s exact test nominal P-value
3Annotation source (Reactome, GO biological process (BP), molecular function (MF) and cellular component (CC))
4GO category or Reactome pathway
5High-level branch of annotation tree
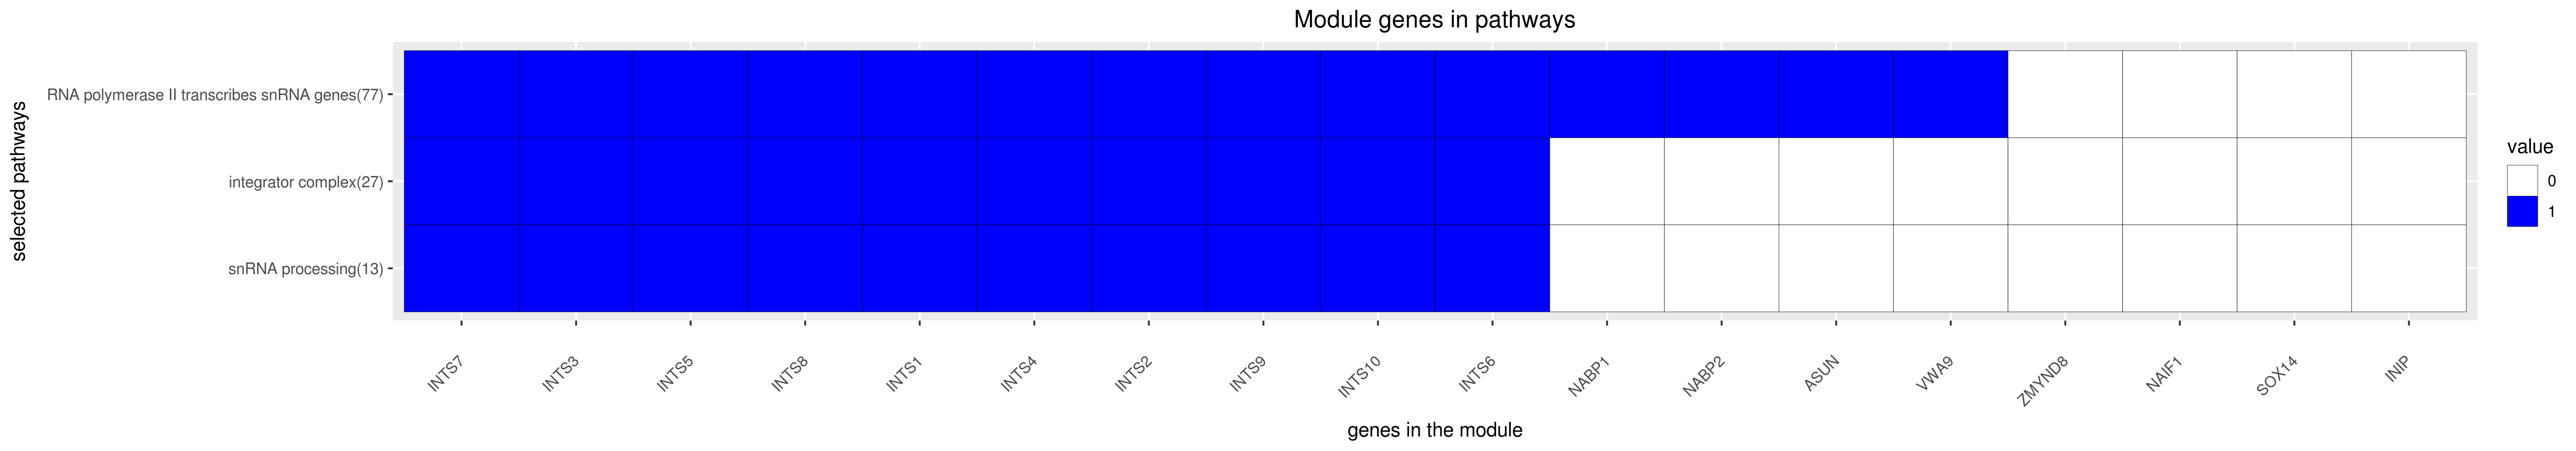
Gene membership
All enriched annotations
Gene Ontology
11Nominal enrichment p-value (Wallenius’ noncentral hypergeometric distribution)
2FDR corrected p-value (Benjamini-Hochberg)
Mouse mutant phenotypes
11Nominal enrichment p-value (Wallenius’ noncentral hypergeometric distribution)
2FDR corrected p-value (Benjamini-Hochberg)
Generated on: Thu Aug 30 17:26:27 2018 - R2HTML