Back to main page
DREAM Module Identification Challenge – Consensus modules
PPI-STRING_Consensus_mod130
| Assigned name |
NA |
| Network |
PPI-STRING |
| Module ID |
PPI-STRING_Consensus_mod130 |
| Module size |
21 genes |
|
Module genes
This module comprises the following genes:
| Gene ID |
Gene Symbol |
Gene Name |
| 403
|
ARL3
|
ADP ribosylation factor like GTPase 3
|
| 8915
|
BCL10
|
B cell CLL/lymphoma 10
|
| 7809
|
BSND
|
barttin CLCNK type accessory beta subunit
|
| 84270
|
C9orf89
|
caspase recruitment domain family member 19
|
| 11092
|
C9orf9
|
sperm acrosome associated 9
|
| 79827
|
CLMP
|
CXADR like membrane protein
|
| 51181
|
DCXR
|
dicarbonyl and L-xylulose reductase
|
| 84080
|
ENKD1
|
enkurin domain containing 1
|
| 65983
|
GRAMD3
|
GRAM domain containing 2B
|
| 51512
|
GTSE1
|
G2 and S-phase expressed 1
|
| 283987
|
HID1
|
HID1 domain containing
|
| 22832
|
KIAA1009
|
centrosomal protein 162
|
| 54627
|
KIAA1383
|
microtubule associated protein 10
|
| 284451
|
ODF3L2
|
outer dense fiber of sperm tails 3 like 2
|
| 51308
|
REEP2
|
receptor accessory protein 2
|
| 6102
|
RP2
|
RP2, ARL3 GTPase activating protein
|
| 27230
|
SERP1
|
stress associated endoplasmic reticulum protein 1
|
| 9751
|
SNPH
|
syntaphilin
|
| 727837
|
SSX2B
|
SSX family member 2B
|
| 54867
|
TMEM214
|
transmembrane protein 214
|
| 55829
|
VIMP
|
selenoprotein S
|
|
Functional annotation
Modules were tested for enrichment in functional and pathway annotations using two complementary approaches:
1. To select a small number of specific / non-redundant annotations for each module, a regression-based approach was used;
2. To obtain the complete set of enriched annotations, an extension of Fisher’s exact test that takes annotation bias into account was employed (Wallenius’ non-central hypergeometric distribution).
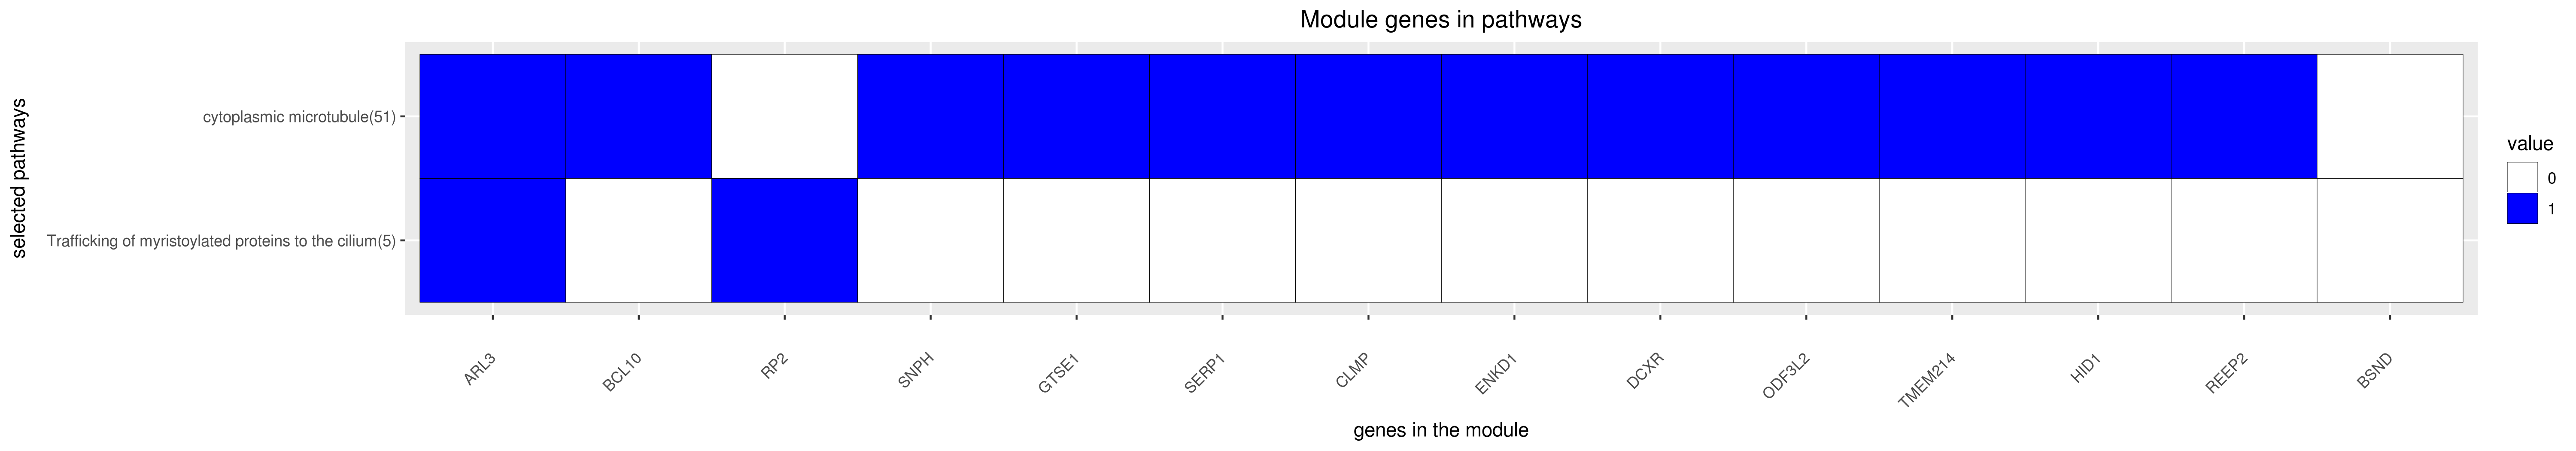
Most specific annotations for this module
1Regression coefficient
2Fisher’s exact test nominal P-value
3Annotation source (Reactome, GO biological process (BP), molecular function (MF) and cellular component (CC))
4GO category or Reactome pathway
5High-level branch of annotation tree
Gene membership
All enriched annotations
Gene Ontology
11Nominal enrichment p-value (Wallenius’ noncentral hypergeometric distribution)
2FDR corrected p-value (Benjamini-Hochberg)
Reactome
| P-value1 |
FDR2 |
Term |
| 3.44e-03
|
3.35e-01
|
DOWNSTREAM TCR SIGNALING
|
| 5.18e-03
|
4.70e-01
|
ACTIVATION OF NF KAPPAB IN B CELLS
|
| 5.44e-03
|
4.40e-01
|
DOWNSTREAM TCR SIGNALING
|
| 6.92e-03
|
5.95e-01
|
DOWNSTREAM SIGNALING EVENTS OF B CELL RECEPTOR BCR
|
| 8.95e-03
|
6.71e-01
|
ACTIVATION OF NF KAPPAB IN B CELLS
|
| 9.01e-03
|
6.75e-01
|
DOWNSTREAM SIGNALING EVENTS OF B CELL RECEPTOR BCR
|
| 9.90e-03
|
7.27e-01
|
TCR SIGNALING
|
| 1.03e-02
|
8.15e-01
|
TCR SIGNALING
|
| 1.21e-02
|
9.26e-01
|
SIGNALING BY THE B CELL RECEPTOR BCR
|
| 1.90e-02
|
1.00e+00
|
SIGNALING BY THE B CELL RECEPTOR BCR
|
| 2.32e-02
|
1.00e+00
|
ACTIVATION OF CHAPERONE GENES BY XBP1S
|
| 3.74e-02
|
1.00e+00
|
ACTIVATION OF CHAPERONE GENES BY XBP1S
|
|
11Nominal enrichment p-value (Wallenius’ noncentral hypergeometric distribution)
2FDR corrected p-value (Benjamini-Hochberg)
Mouse mutant phenotypes
11Nominal enrichment p-value (Wallenius’ noncentral hypergeometric distribution)
2FDR corrected p-value (Benjamini-Hochberg)
Generated on: Thu Aug 30 17:26:09 2018 - R2HTML