Back to main page
DREAM Module Identification Challenge – Consensus modules
PPI-STRING_Consensus_mod11
| Assigned name |
NA |
| Network |
PPI-STRING |
| Module ID |
PPI-STRING_Consensus_mod11 |
| Module size |
13 genes |
|
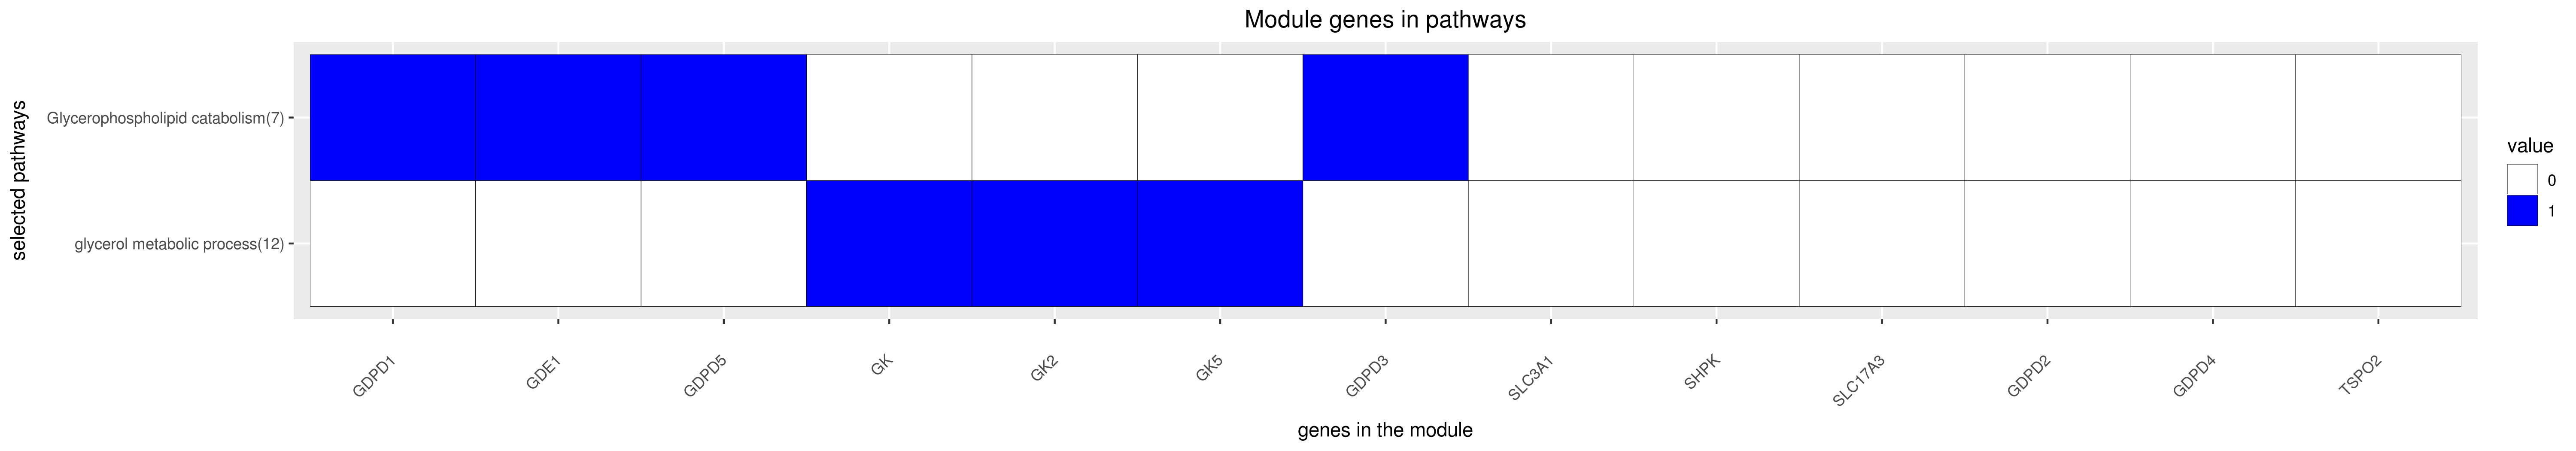
Module genes
This module comprises the following genes:
| Gene ID |
Gene Symbol |
Gene Name |
| 51573
|
GDE1
|
glycerophosphodiester phosphodiesterase 1
|
| 284161
|
GDPD1
|
glycerophosphodiester phosphodiesterase domain containing 1
|
| 54857
|
GDPD2
|
glycerophosphodiester phosphodiesterase domain containing 2
|
| 79153
|
GDPD3
|
glycerophosphodiester phosphodiesterase domain containing 3
|
| 220032
|
GDPD4
|
glycerophosphodiester phosphodiesterase domain containing 4
|
| 81544
|
GDPD5
|
glycerophosphodiester phosphodiesterase domain containing 5
|
| 2645
|
GK
|
glucokinase
|
| 2585
|
GK2
|
galactokinase 2
|
| 256356
|
GK5
|
glycerol kinase 5
|
| 23729
|
SHPK
|
sedoheptulokinase
|
| 10786
|
SLC17A3
|
solute carrier family 17 member 3
|
| 6519
|
SLC3A1
|
solute carrier family 3 member 1
|
| 222642
|
TSPO2
|
translocator protein 2
|
|
Functional annotation
Modules were tested for enrichment in functional and pathway annotations using two complementary approaches:
1. To select a small number of specific / non-redundant annotations for each module, a regression-based approach was used;
2. To obtain the complete set of enriched annotations, an extension of Fisher’s exact test that takes annotation bias into account was employed (Wallenius’ non-central hypergeometric distribution).
Most specific annotations for this module
1Regression coefficient
2Fisher’s exact test nominal P-value
3Annotation source (Reactome, GO biological process (BP), molecular function (MF) and cellular component (CC))
4GO category or Reactome pathway
5High-level branch of annotation tree
Gene membership
All enriched annotations
Gene Ontology
11Nominal enrichment p-value (Wallenius’ noncentral hypergeometric distribution)
2FDR corrected p-value (Benjamini-Hochberg)
Reactome
| P-value1 |
FDR2 |
Term |
| 1.14e-02
|
8.84e-01
|
TRIGLYCERIDE BIOSYNTHESIS
|
| 1.96e-02
|
1.00e+00
|
AMINO ACID TRANSPORT ACROSS THE PLASMA MEMBRANE
|
| 2.08e-02
|
1.00e+00
|
AMINO ACID TRANSPORT ACROSS THE PLASMA MEMBRANE
|
| 2.08e-02
|
1.00e+00
|
AMINO ACID AND OLIGOPEPTIDE SLC TRANSPORTERS
|
| 2.33e-02
|
1.00e+00
|
TRIGLYCERIDE BIOSYNTHESIS
|
| 3.06e-02
|
1.00e+00
|
AMINO ACID AND OLIGOPEPTIDE SLC TRANSPORTERS
|
| 3.55e-02
|
1.00e+00
|
TRANSPORT OF INORGANIC CATIONS ANIONS AND AMINO ACIDS OLIGOPEPTIDES
|
|
11Nominal enrichment p-value (Wallenius’ noncentral hypergeometric distribution)
2FDR corrected p-value (Benjamini-Hochberg)
Mouse mutant phenotypes
11Nominal enrichment p-value (Wallenius’ noncentral hypergeometric distribution)
2FDR corrected p-value (Benjamini-Hochberg)
Generated on: Thu Aug 30 17:20:10 2018 - R2HTML